Image 1 of 1: ‘Python_Repl’
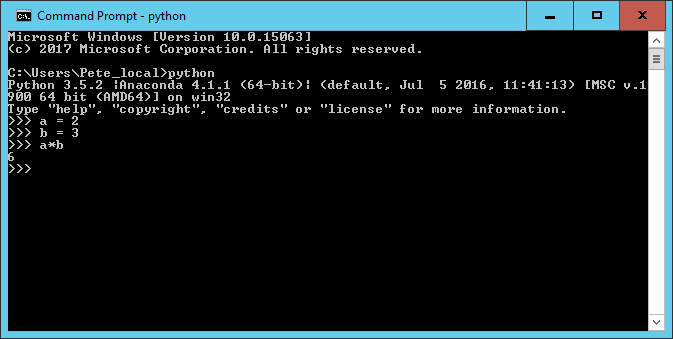
Image 1 of 1: ‘Jupyter_notebook_list’
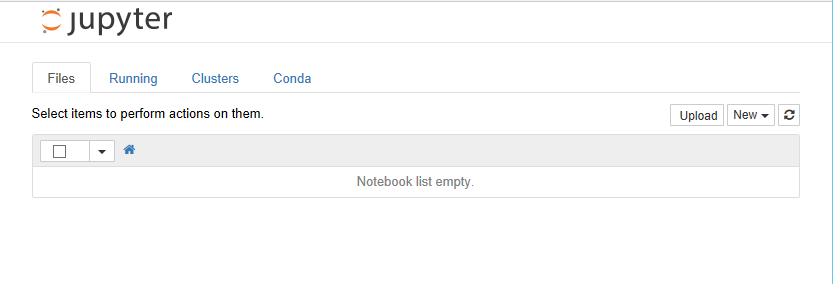
Image 1 of 1: ‘Jupyter_notebook’
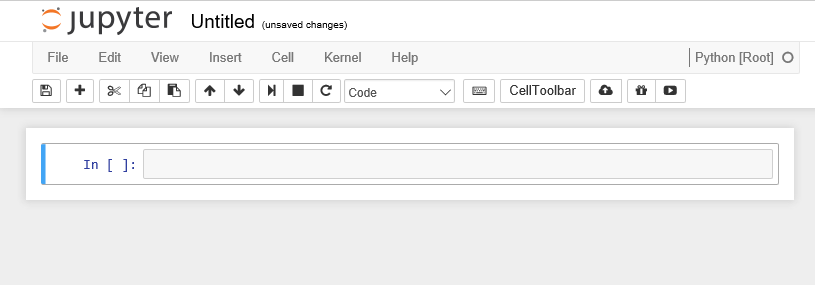
Image 1 of 1: ‘Jupyter_notebook_cell’

Image 1 of 1: ‘Print parameter information’
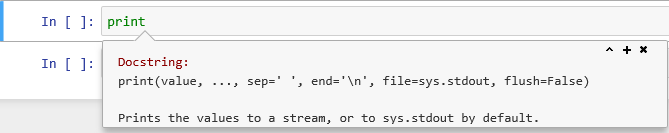
Image 1 of 1: ‘Python_Repl’
Image 1 of 1: ‘pandas_join_types’
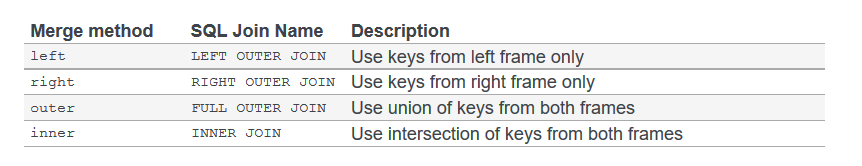
Image 1 of 1: ‘Histogram of years lived spotlighting how to plot a variable with Pandas’
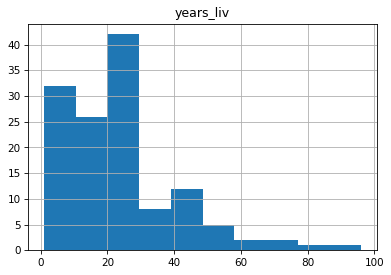
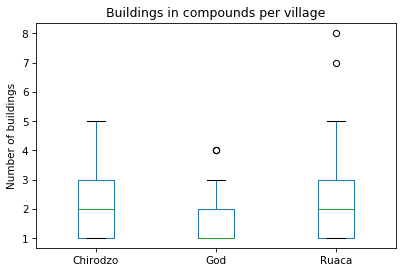
Image 1 of 1: ‘Three separate histograms depicting the number of years lived by village; Chirodzo, God, Ruaca’
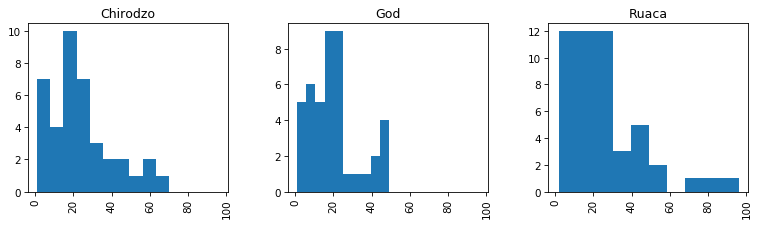
Image 1 of 1: ‘png’
Image 1 of 1: ‘png’
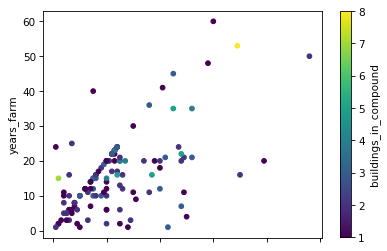
Image 1 of 1: ‘png’
Image 1 of 1: ‘png’
Image 1 of 1: ‘png’
Image 1 of 1: ‘Plot showing years lived and years farmed by village to spotlight the use of linear models’
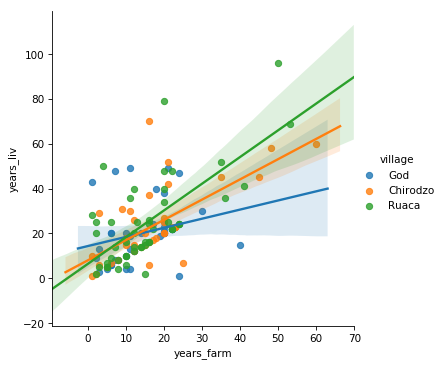
Image 1 of 1: ‘png’
Image 1 of 1: ‘png’