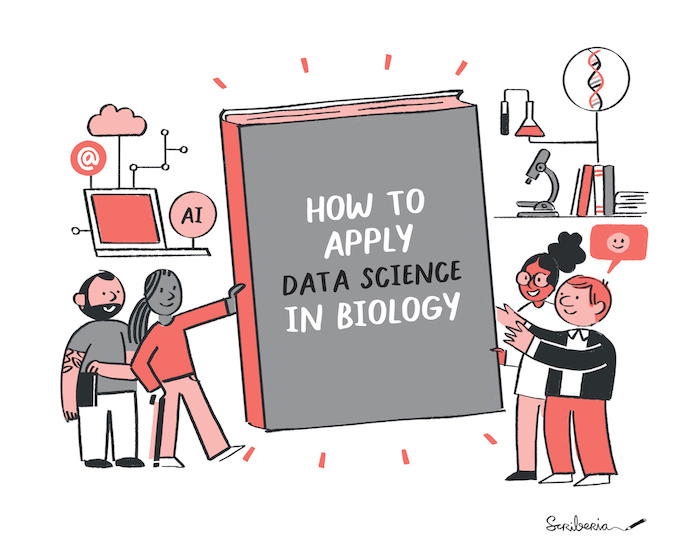
Image 1 of 1: ‘Two people with computational expertise holding a giant book towards two other people who conduct lab experiments. The book saya: how to apply data science in biology.’
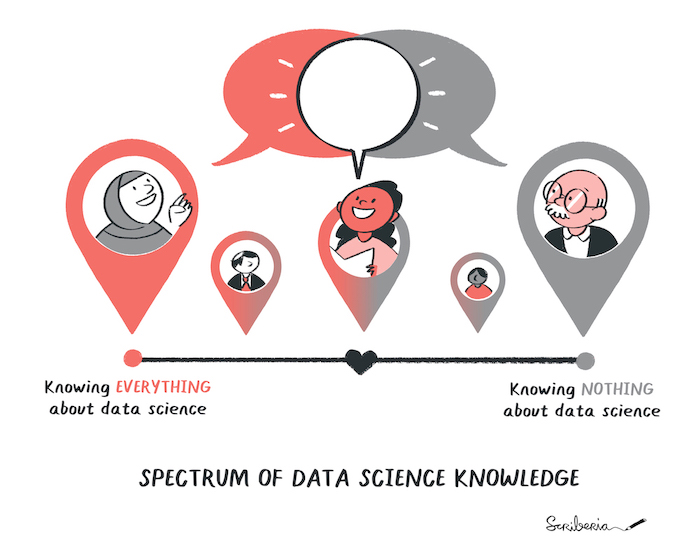
Image 1 of 1: ‘Researchers represented in a map indicating their journey to understand and apply computational approaches. Some may have just started their journey, some may have come far in the learning and some may have gained proficiency based on their research requirements.’
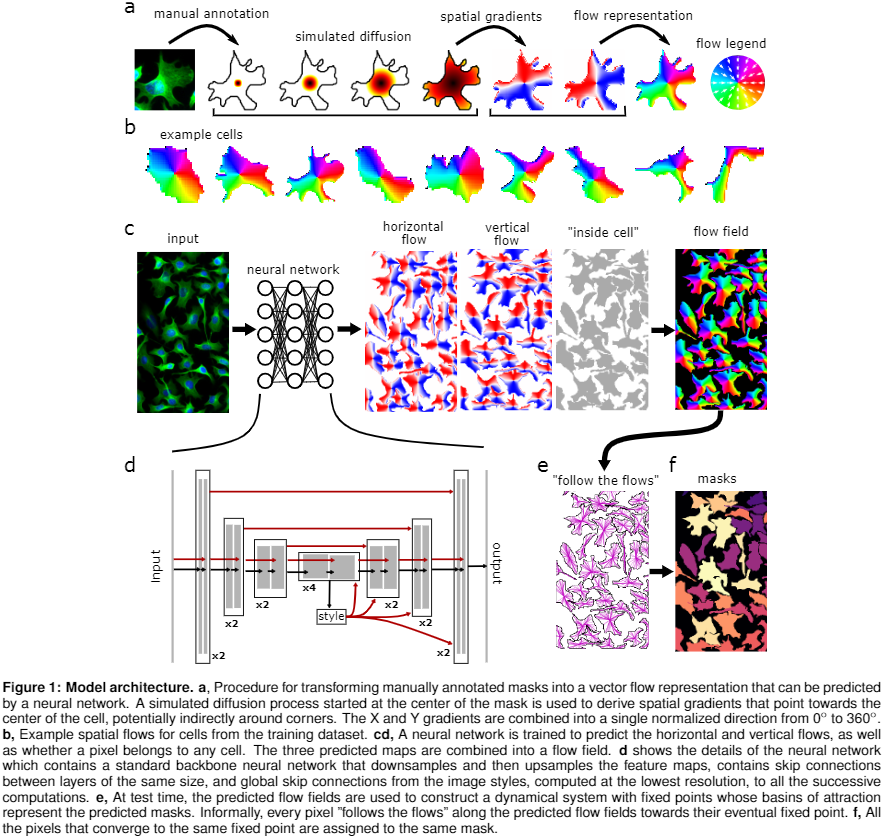
Figure 2
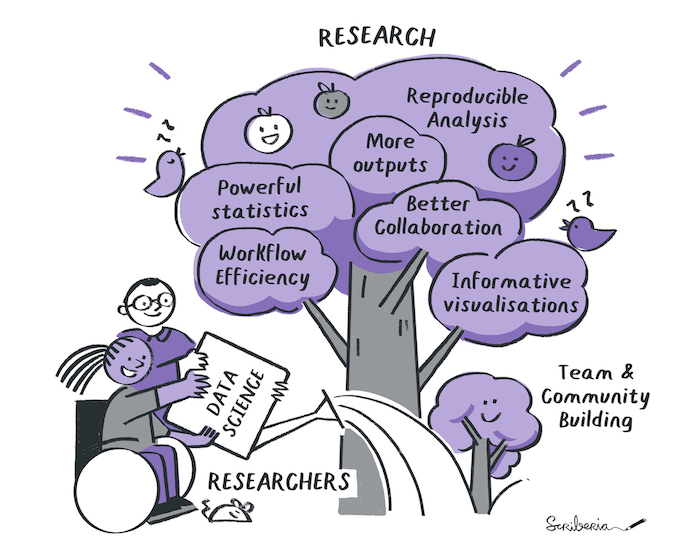
Image 1 of 1: ‘Researchers pour water on a tree, the water represents data science, the tree is the research.’
Figure 3
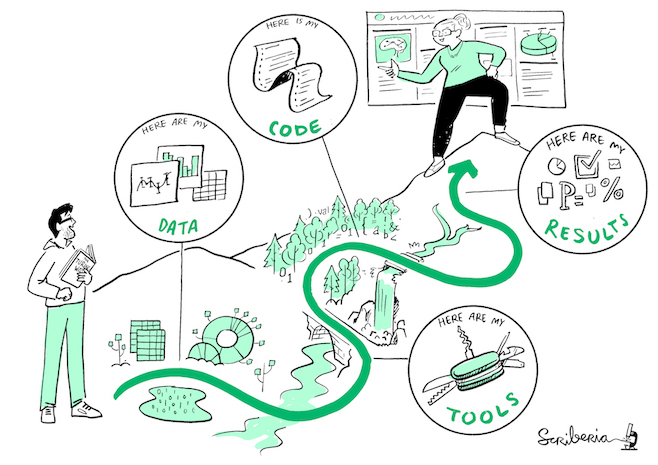
Image 1 of 1: ‘Shows a landscape with different checkpoints fpr data, code, tools and result each of which require reproducible practices. There is a woman explaining her reproducibility journey to help new people start their journey’
Figure 4
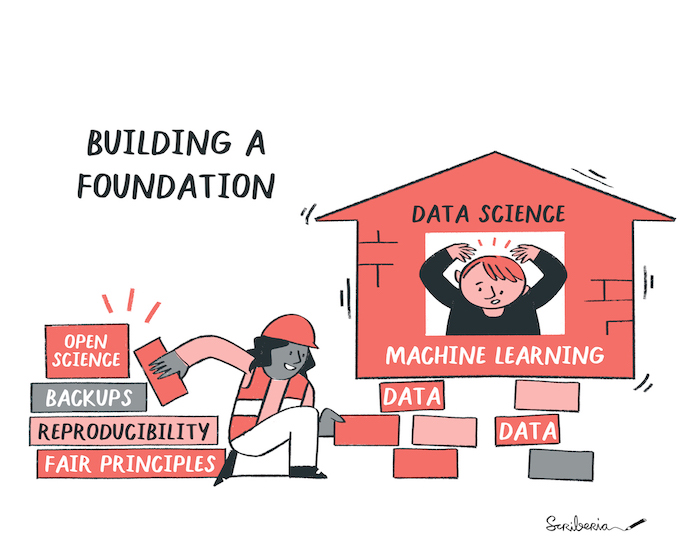
Image 1 of 1: ‘A house representing machine learing and AI is set upon bricks that one person is sliding below the house. On the bricks, we can read data science principles like open science, backups, reproducibiliy, and FAIR principles.’
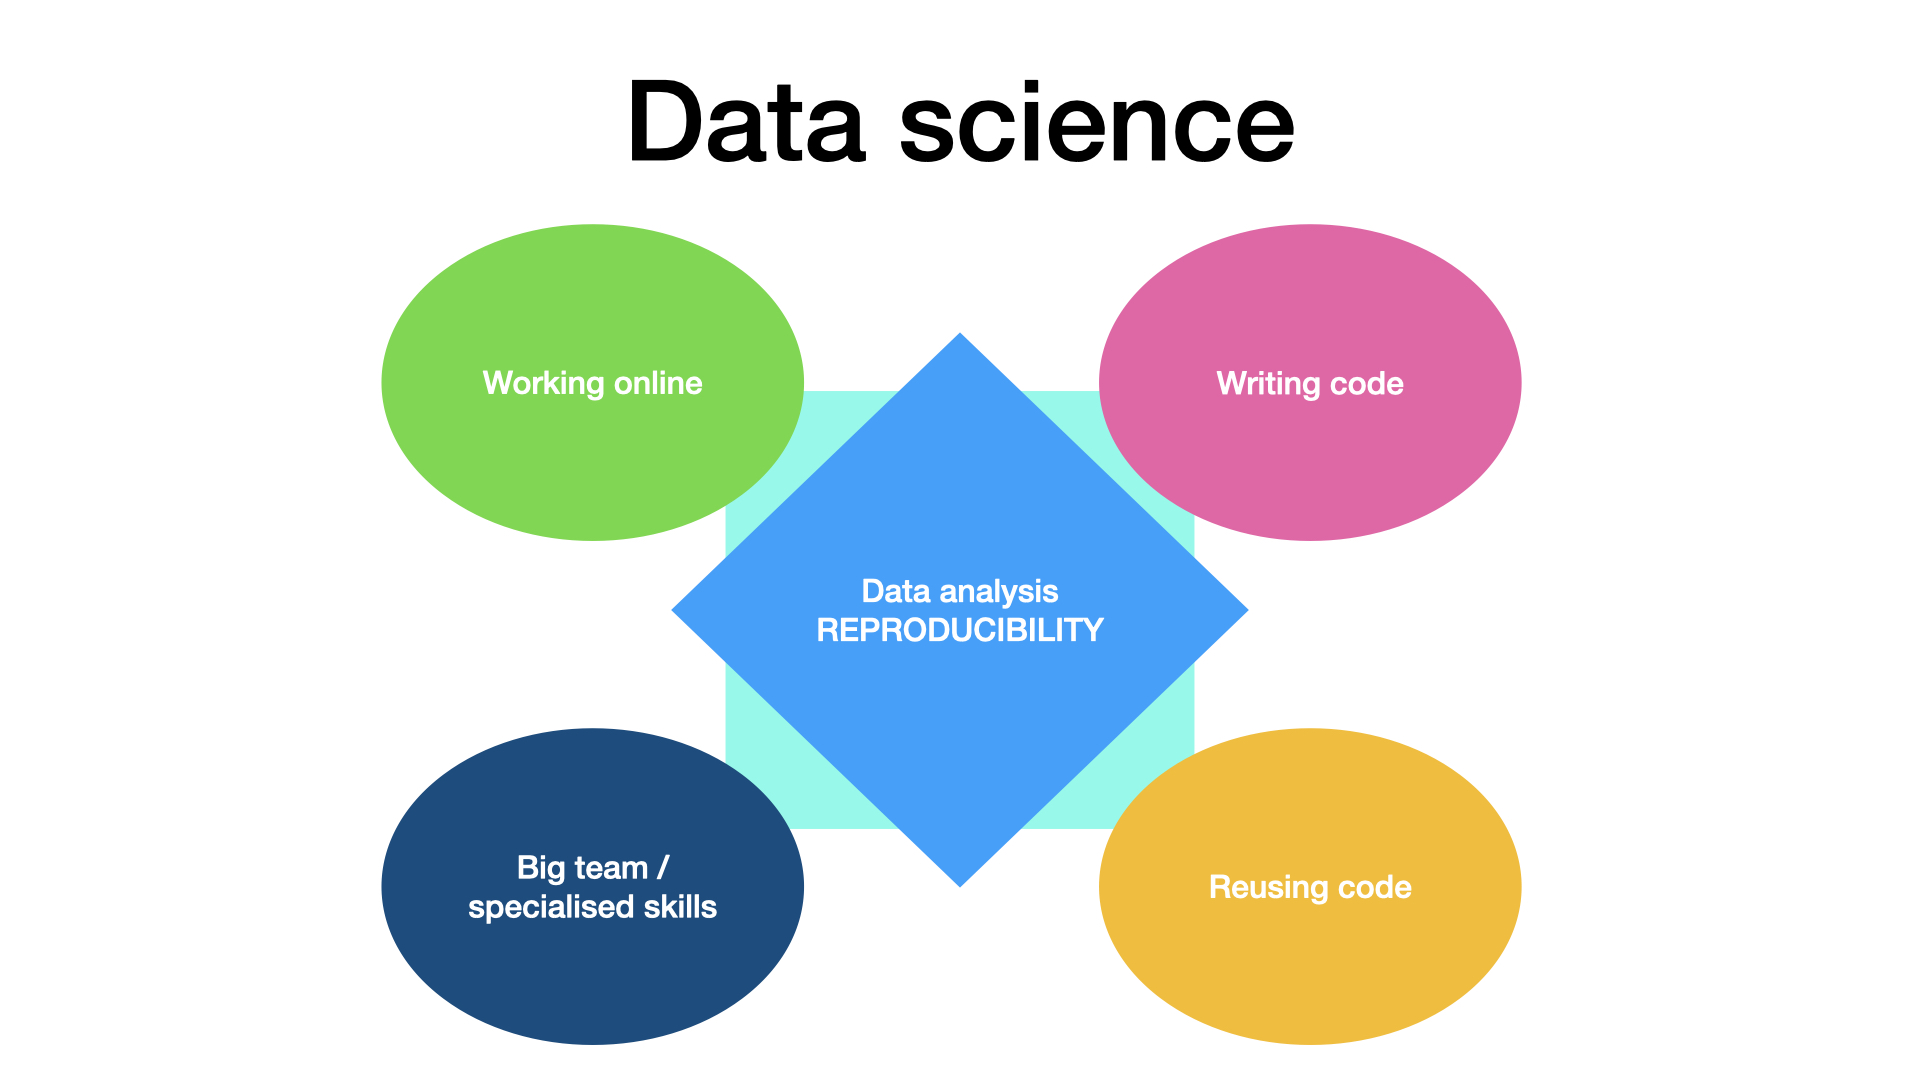
Image 1 of 1: ‘Specicity of data science project. Five blocks (working online, large teams whose members have with specialised skills, writing code and re-using code) are placed around a central block where reproducible analysis is written. Data specifics by Julien Colomb CC-BY 4.0 ’
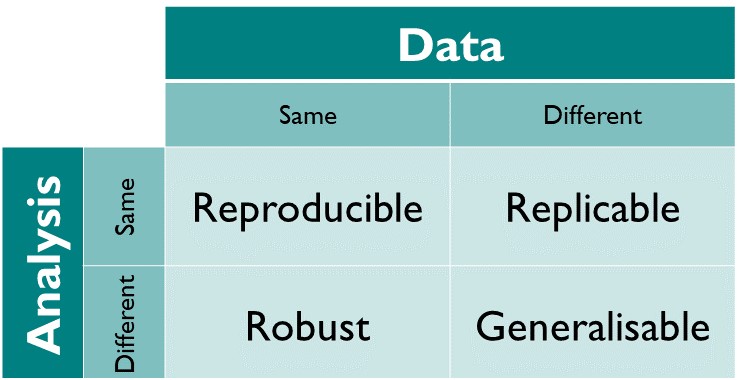
Image 1 of 1: ‘A matrix showing data and analysis in two axis and iterating that reproducibility is when same analysis is applied to same data it gives same result.’
Figure 2
Image 1 of 1: ‘Ways of capturing computational environments’
Image 1 of 1: ‘Contrast in project history management. On the left - choosing between ambiguosly named files. On the right - picking between successive versions (from V1 to V6).’
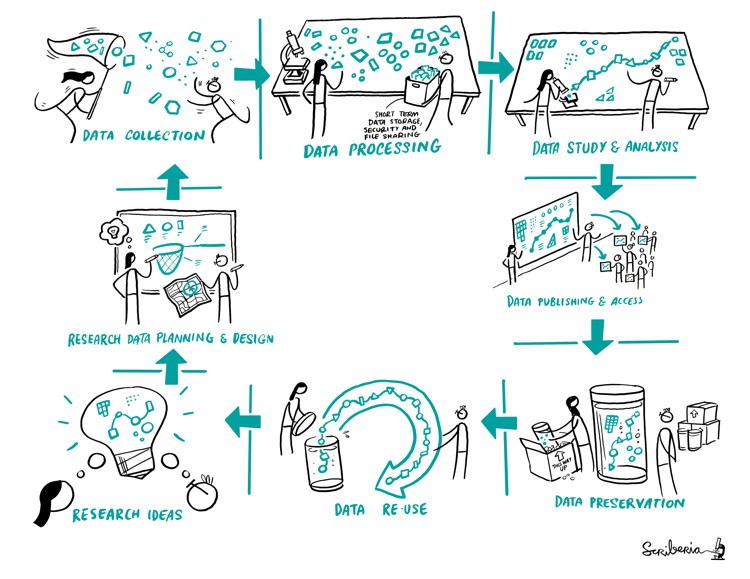
Image 1 of 1: ‘The research process is represented as a perpetual cycle of generating research ideas, performing data planning and design, data collection, and data processing and analysis, publishing, preserving and hence, allowing re-use of data.’
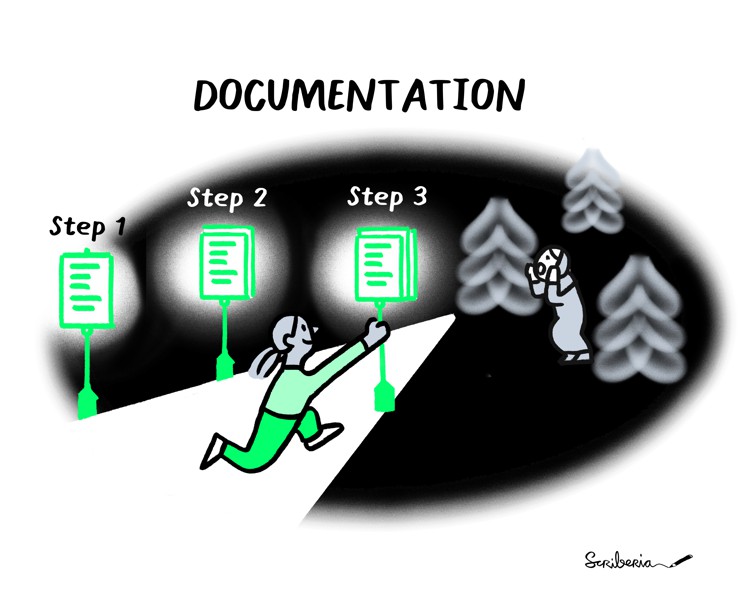
Image 1 of 1: ‘Image shows a person putting lamp-posts of documentation, helping a researcher who was lost because of lack of information about the research.’
You can release code and data associated with a research article as a
series of files/folders. If your project follows the folder template
introduced in a previous episode, for example:
Figure 4
Image 1 of 1: ‘drawing’
Figure 5
Image 1 of 1: ‘drawing’
Figure 6
Image 1 of 1: ‘drawing’
Figure 7
Image 1 of 1: ‘drawing’
Figure 8
Image 1 of 1: ‘drawing’
Figure 9
Figure 10
Image 1 of 1: ‘drawing’
Figure 11
Image 1 of 1: ‘drawing’
Figure 12
Image 1 of 1: ‘drawing’
Extensive tools to annotate and view images, including whole slide
& microscopy images. Interactive machine learning for both object
& pixel classification.
Image 1 of 1: ‘Image shows a person having internal debate about open vesus closed research. Open means new opportunities and inclusivity but closed maybe required to ensure data sensitivity or wrongly assumed for funding for novel work.’
Figure 2
Image 1 of 1: ‘Image shows a woman slowly gaining trust and confidence in opening up her research project and benefitting from open collaboration’


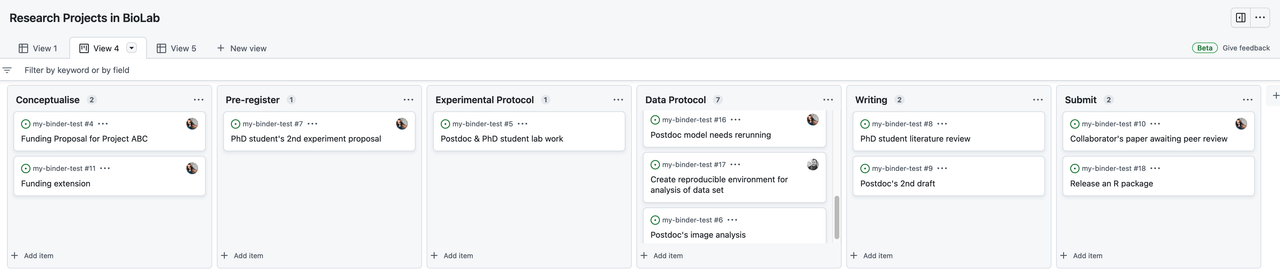
 A traditional Kanban for a collaborative computational project.
Keeping track of bugs and what everyone is working on.
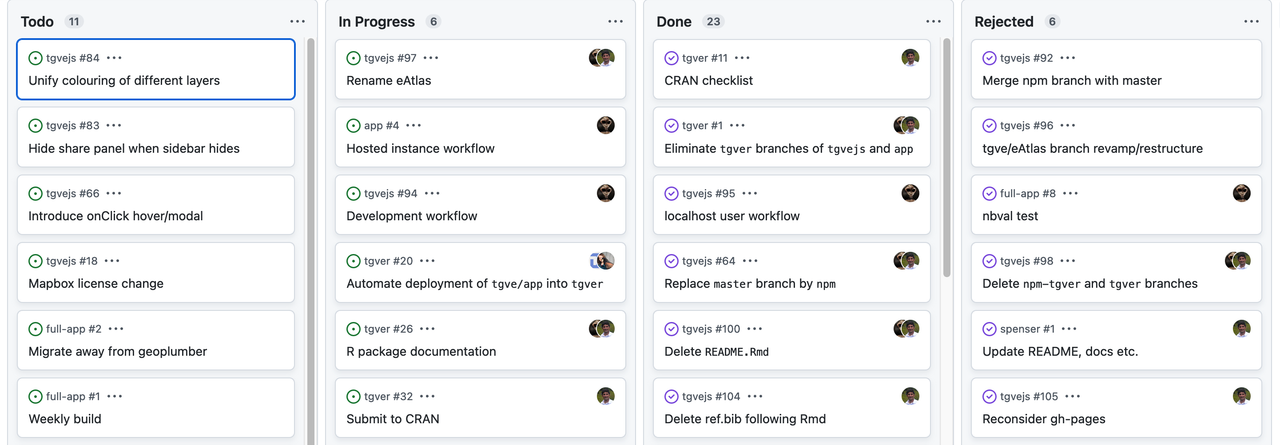
A traditional Kanban for a collaborative computational project.
Keeping track of bugs and what everyone is working on.


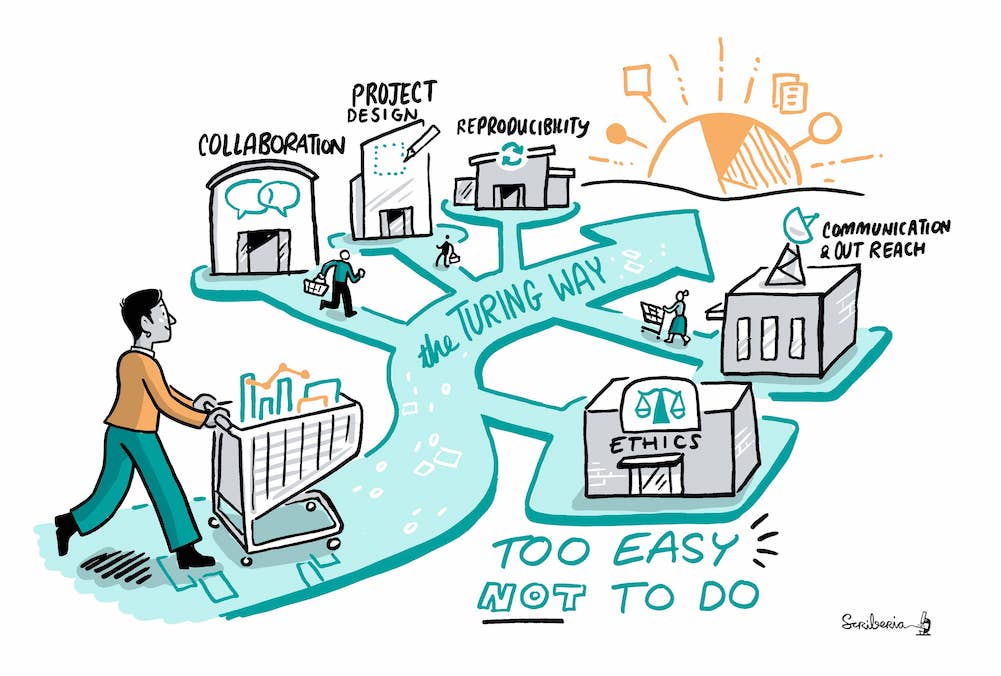
 The Turing Way project illustration by Scriberia. Used under a CC-BY
4.0 licence. DOI: 10.5281/zenodo.3332807.
The Turing Way project illustration by Scriberia. Used under a CC-BY
4.0 licence. DOI: 10.5281/zenodo.3332807.
 The Turing Way
project illustration by Scriberia. Used under a CC-BY 4.0 licence. DOI:
10.5281/zenodo.3332807.
The Turing Way
project illustration by Scriberia. Used under a CC-BY 4.0 licence. DOI:
10.5281/zenodo.3332807.