Image 1 of 1: ‘Bacteria colony’
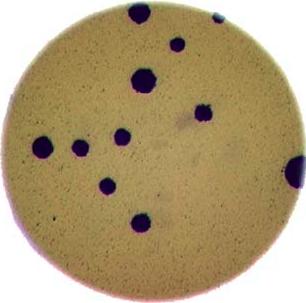
Image 1 of 1: ‘Colonies counted’
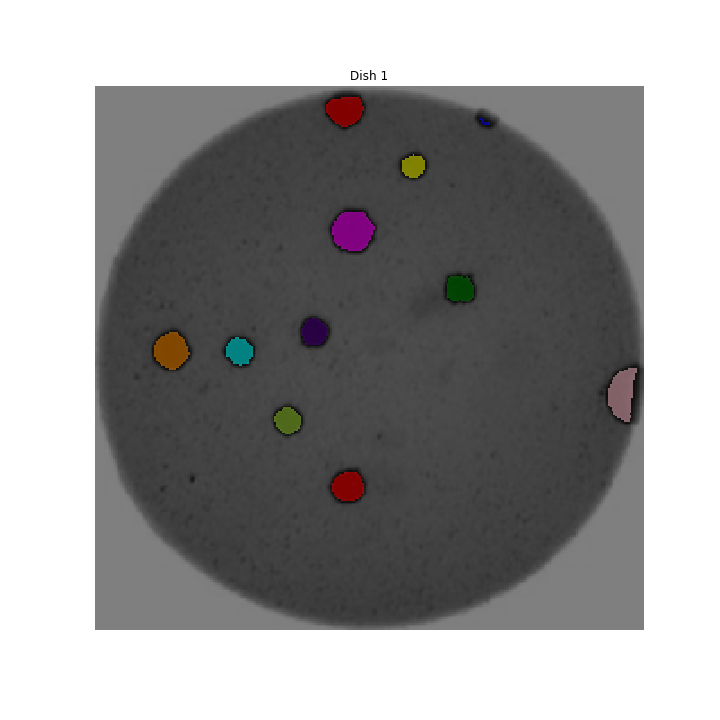
Image 1 of 1: ‘Bacteria colony’
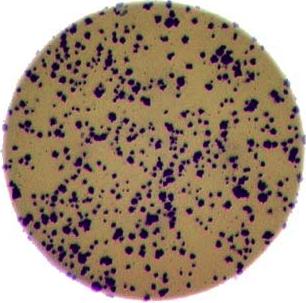
Image 1 of 1: ‘Original size image’
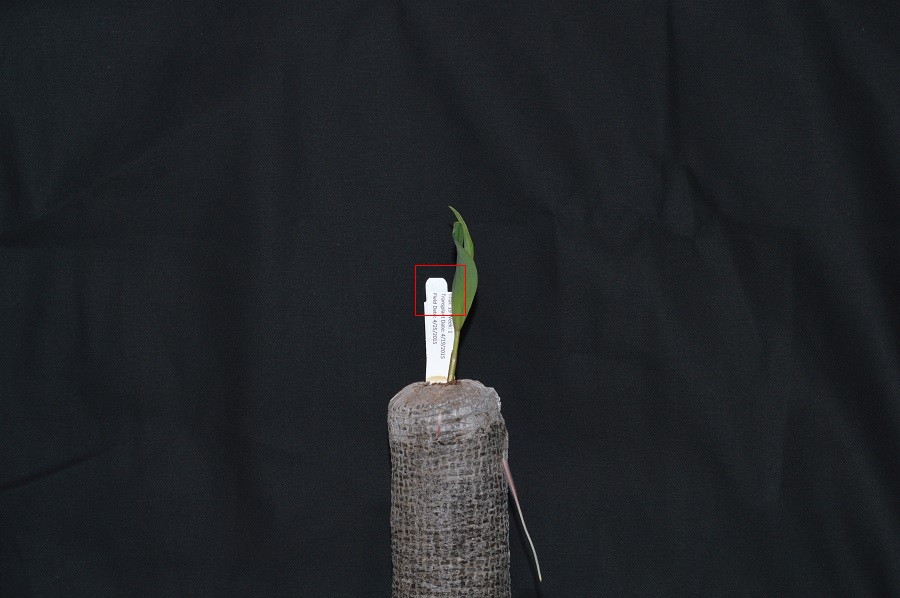
Image 1 of 1: ‘Enlarged image area’
Image 1 of 1: ‘Image of 8’
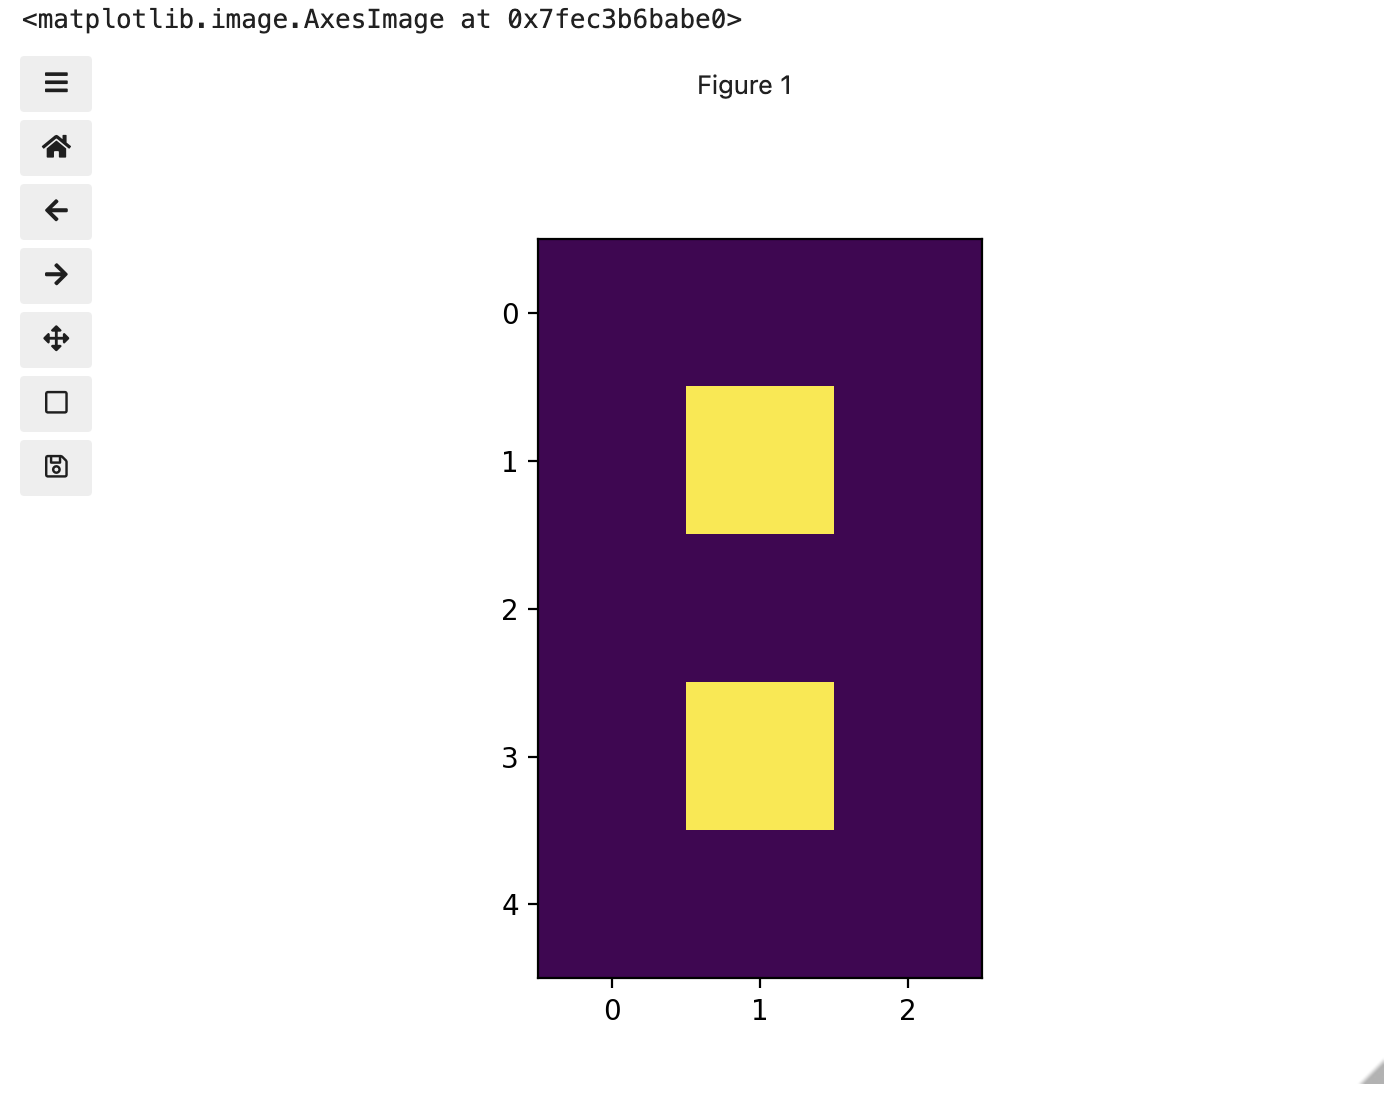
Image 1 of 1: ‘Image of 0’
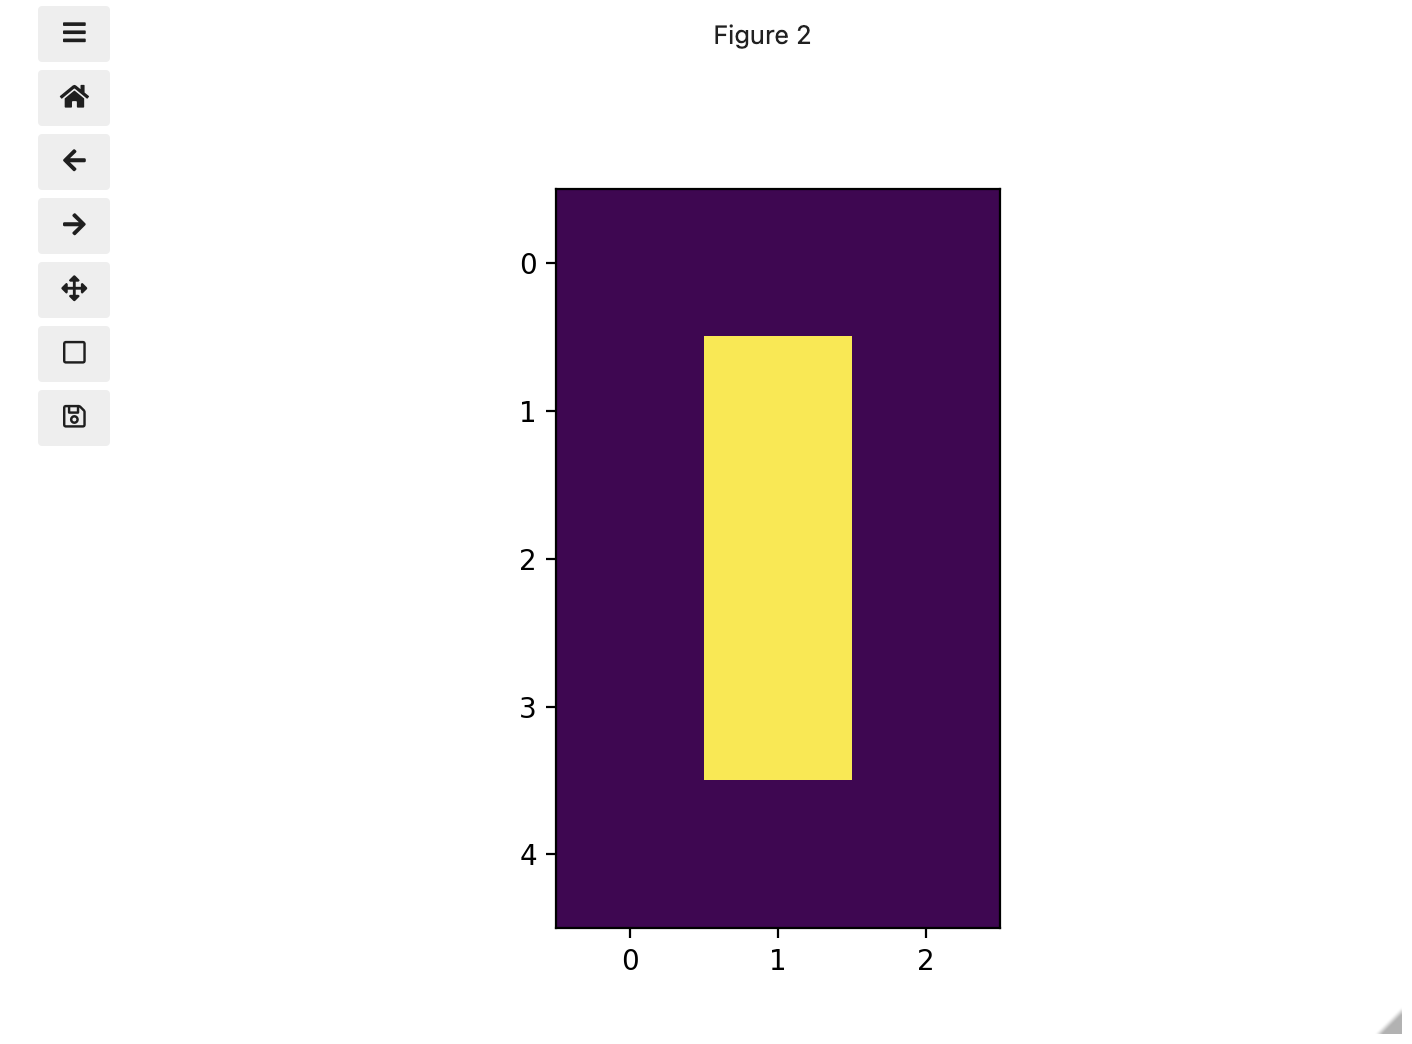
Image 1 of 1: ‘Cartesian coordinate system’
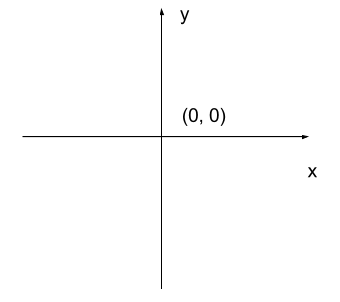
Image 1 of 1: ‘Image coordinate system’
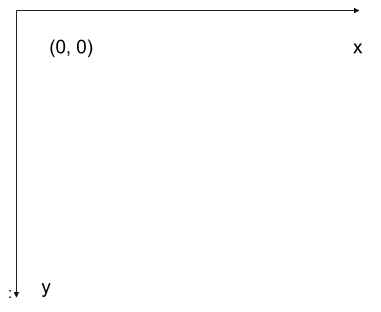
Image 1 of 1: ‘Left-hand coordinate system’
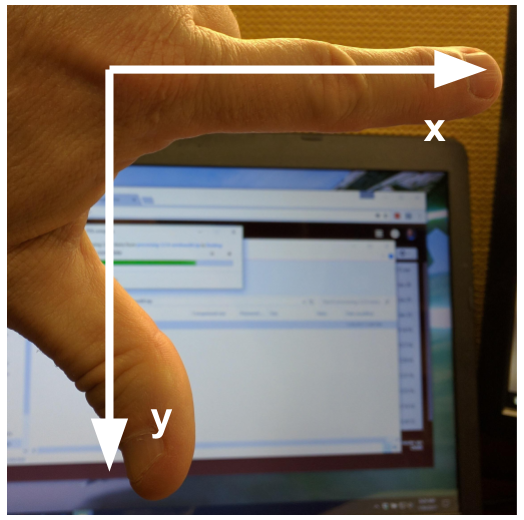
Image 1 of 1: ‘Image of 5’
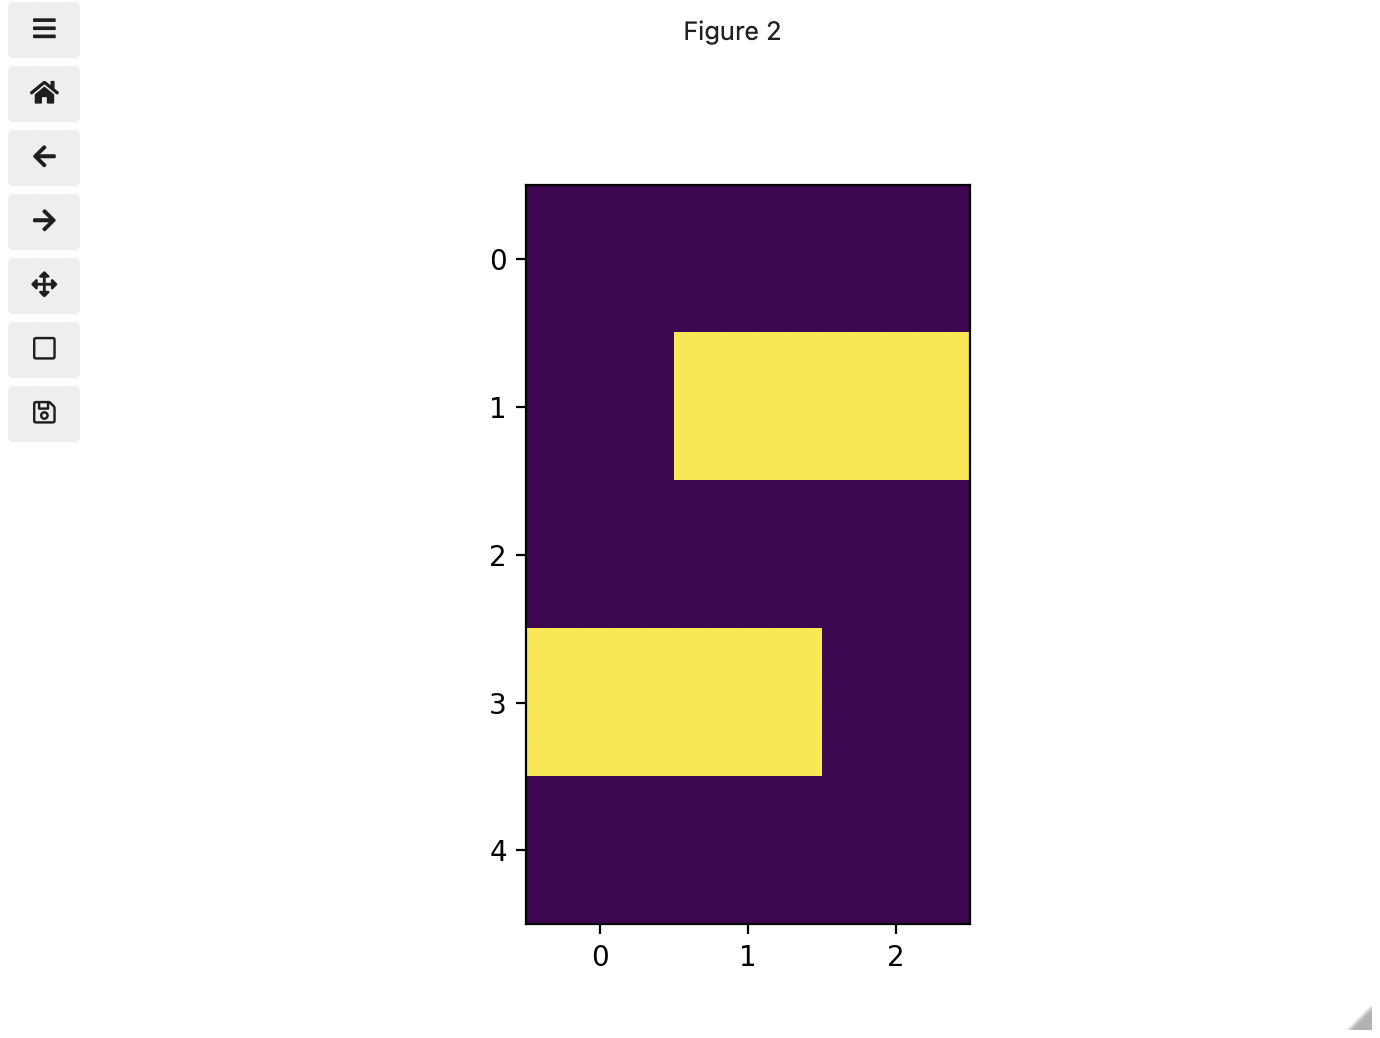
Image 1 of 1: ‘Image of three colours’
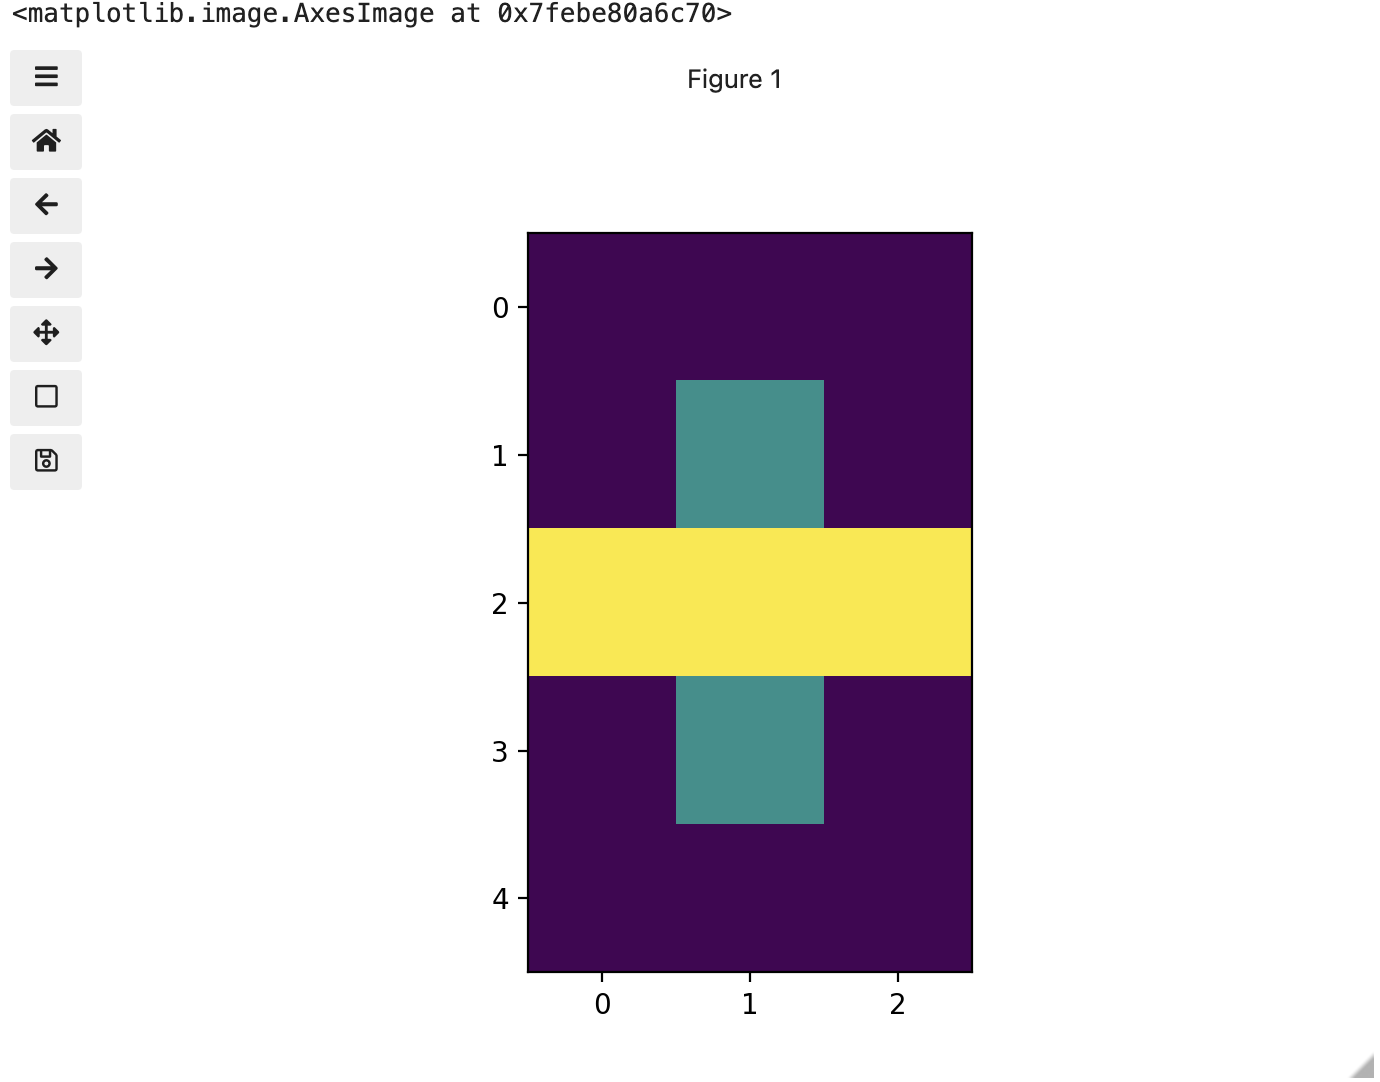
Image 1 of 1: ‘Image in greyscale’
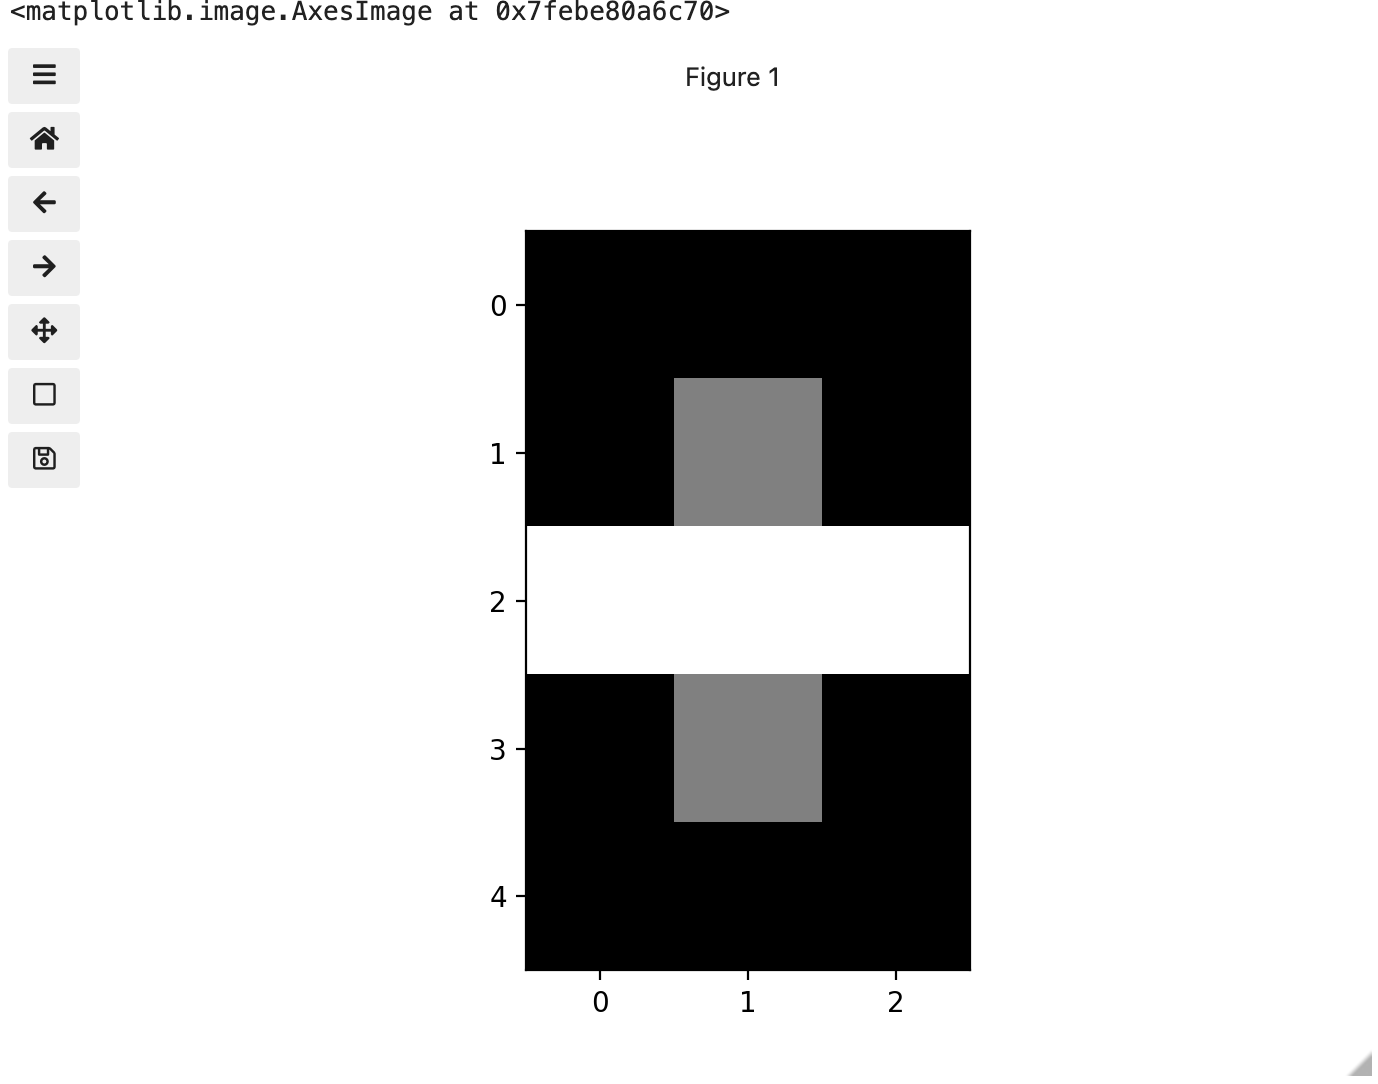
Image 1 of 1: ‘Image of checkerboard’
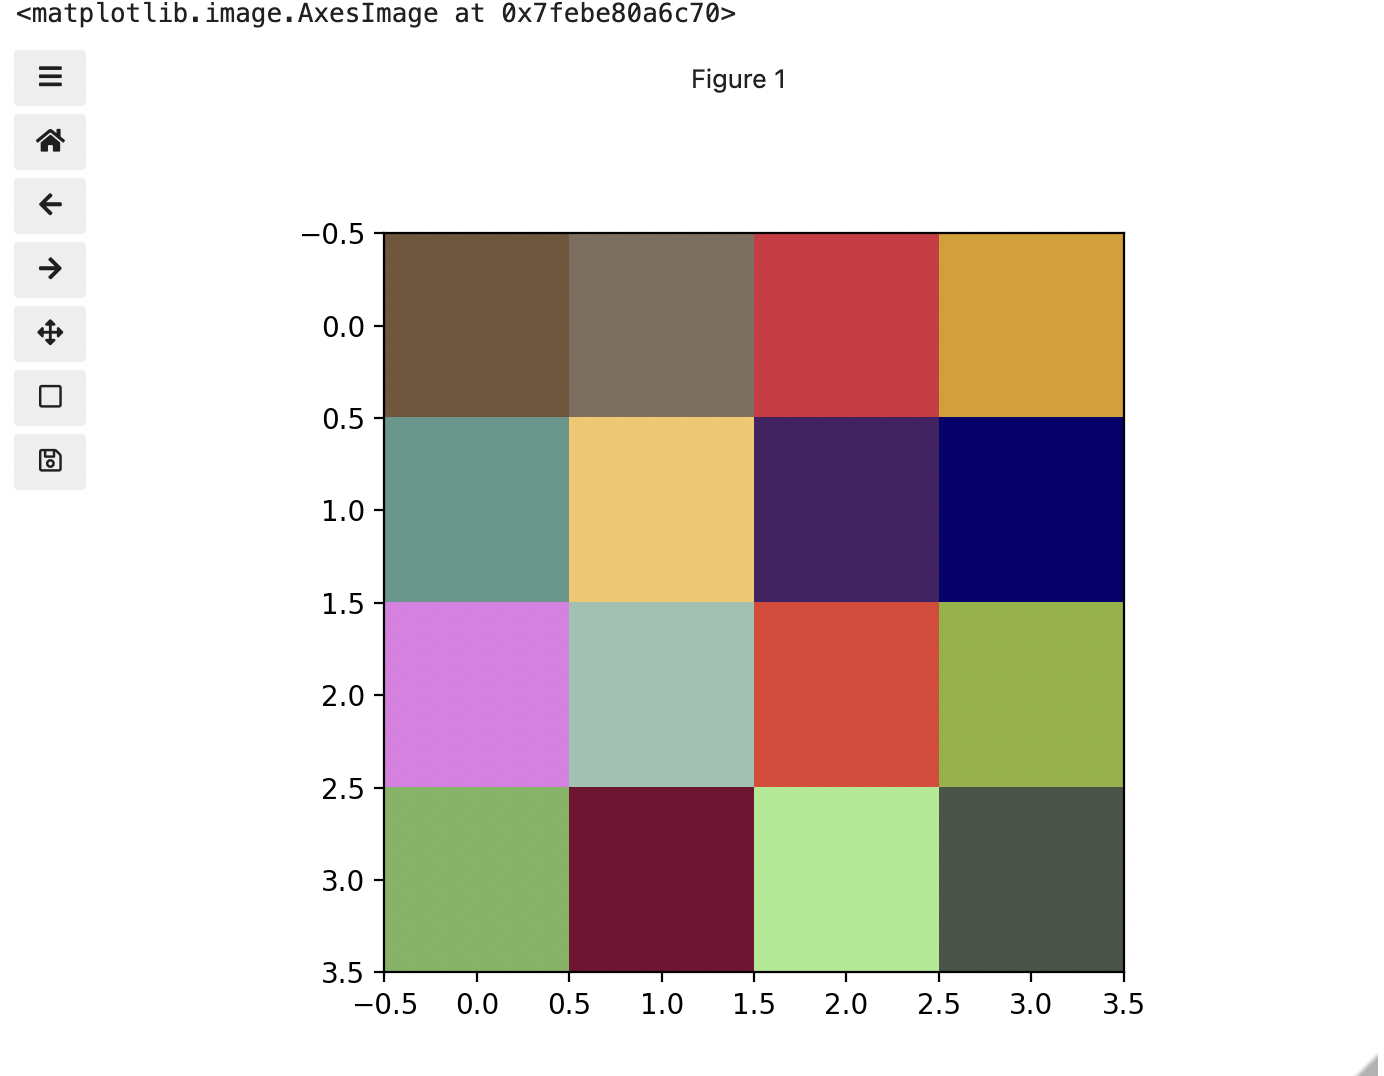
Image 1 of 1: ‘Image of red channel’
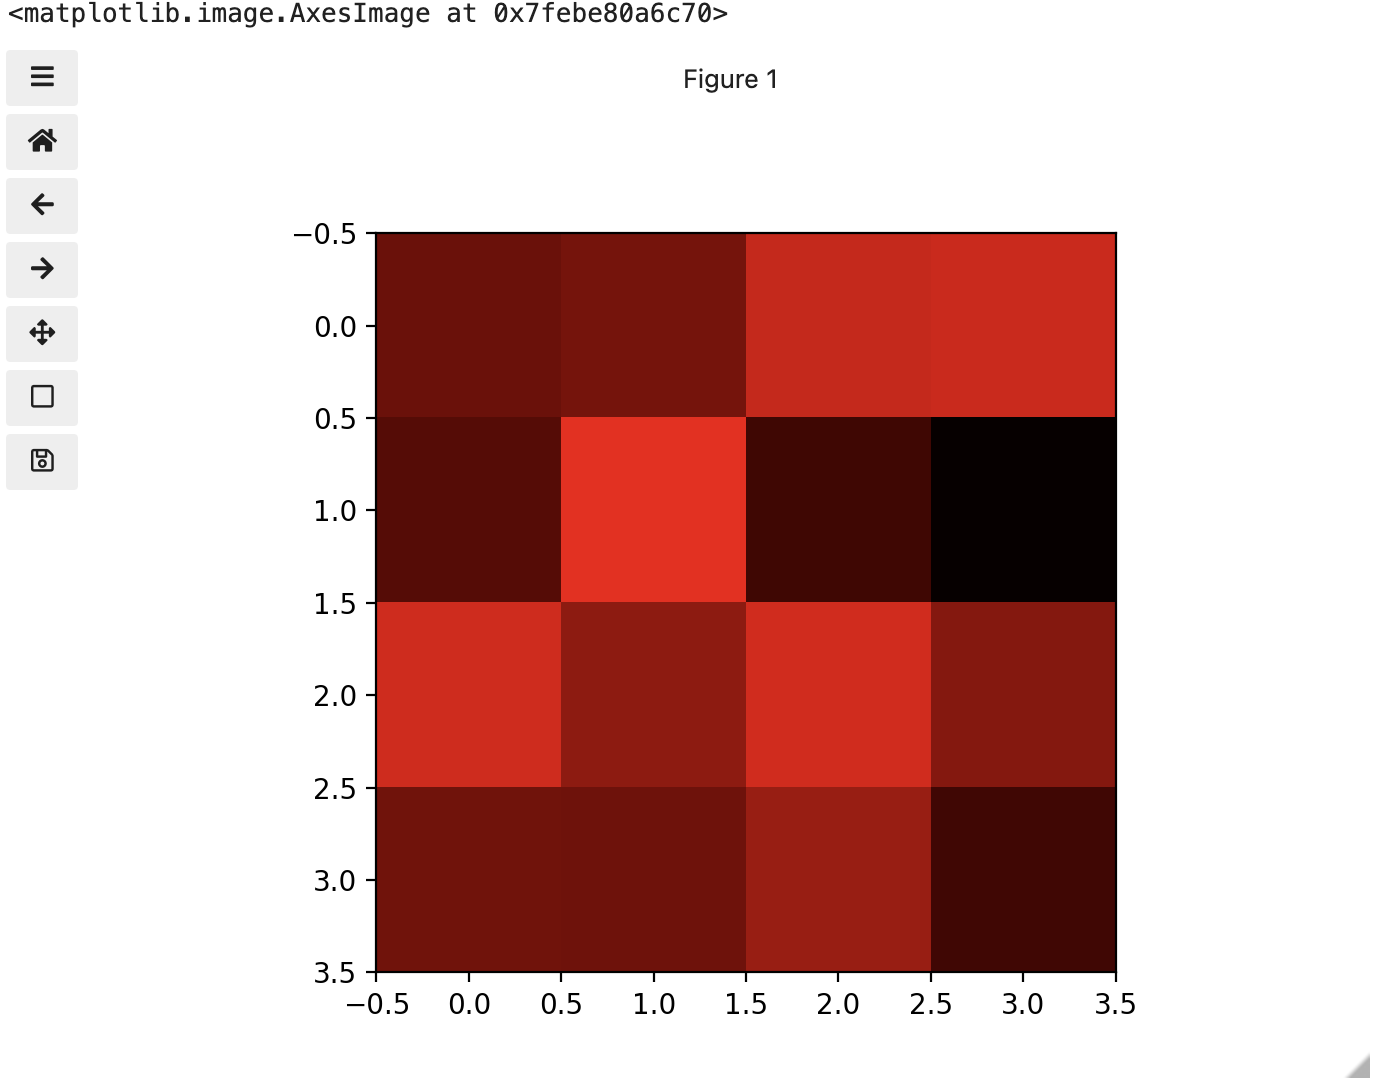
Image 1 of 1: ‘Image of green channel’
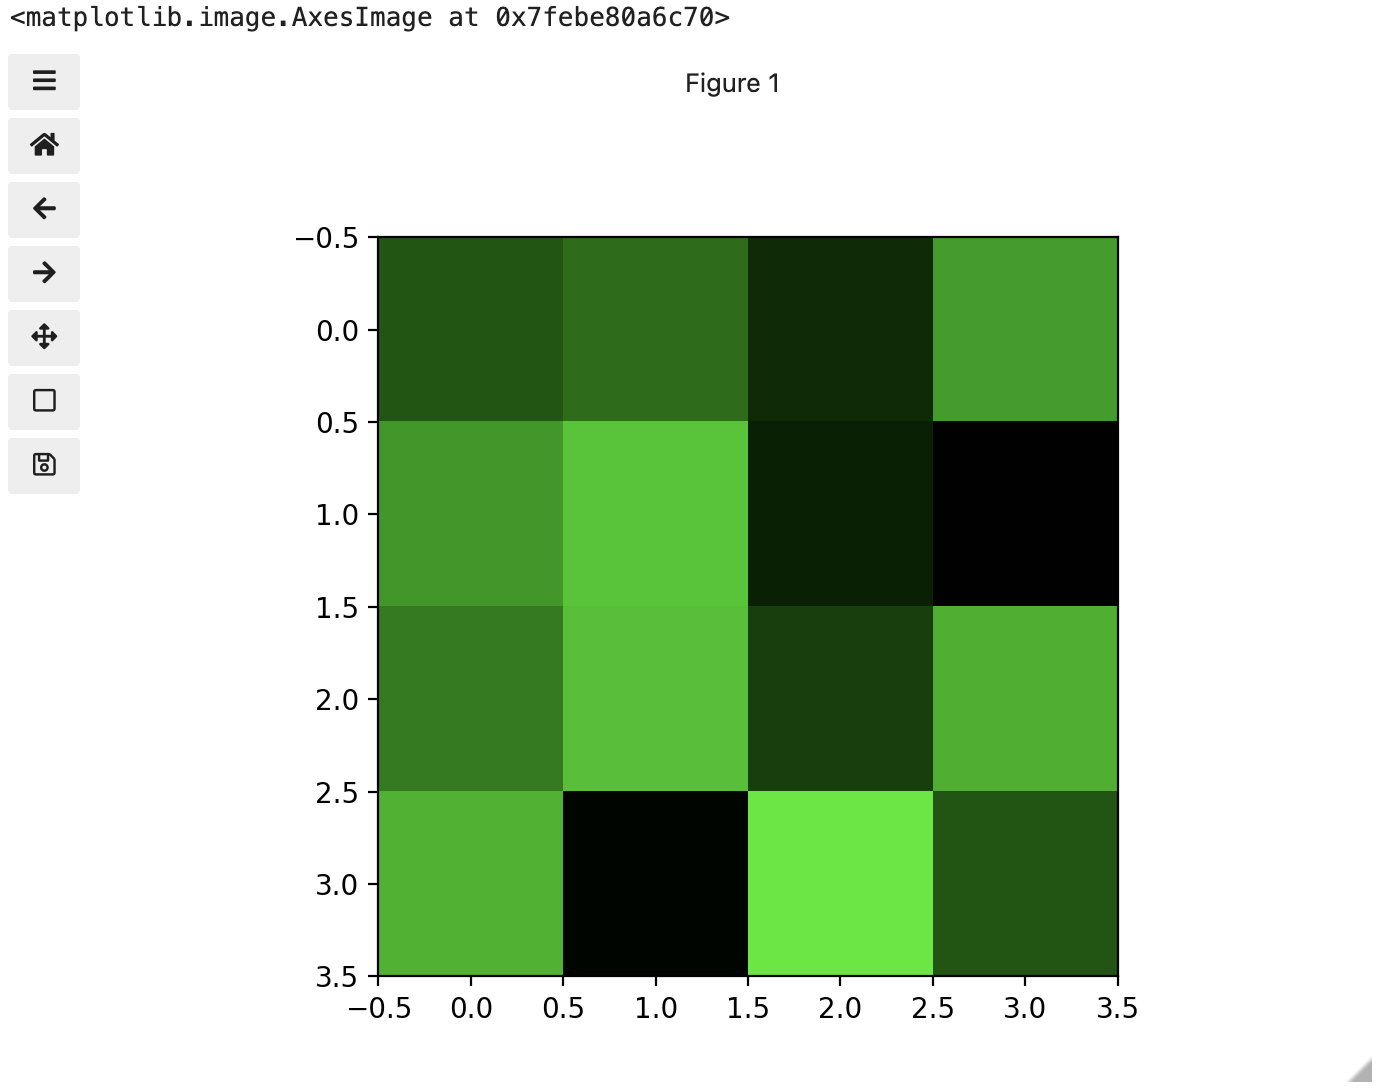
Image 1 of 1: ‘Image of blue channel’
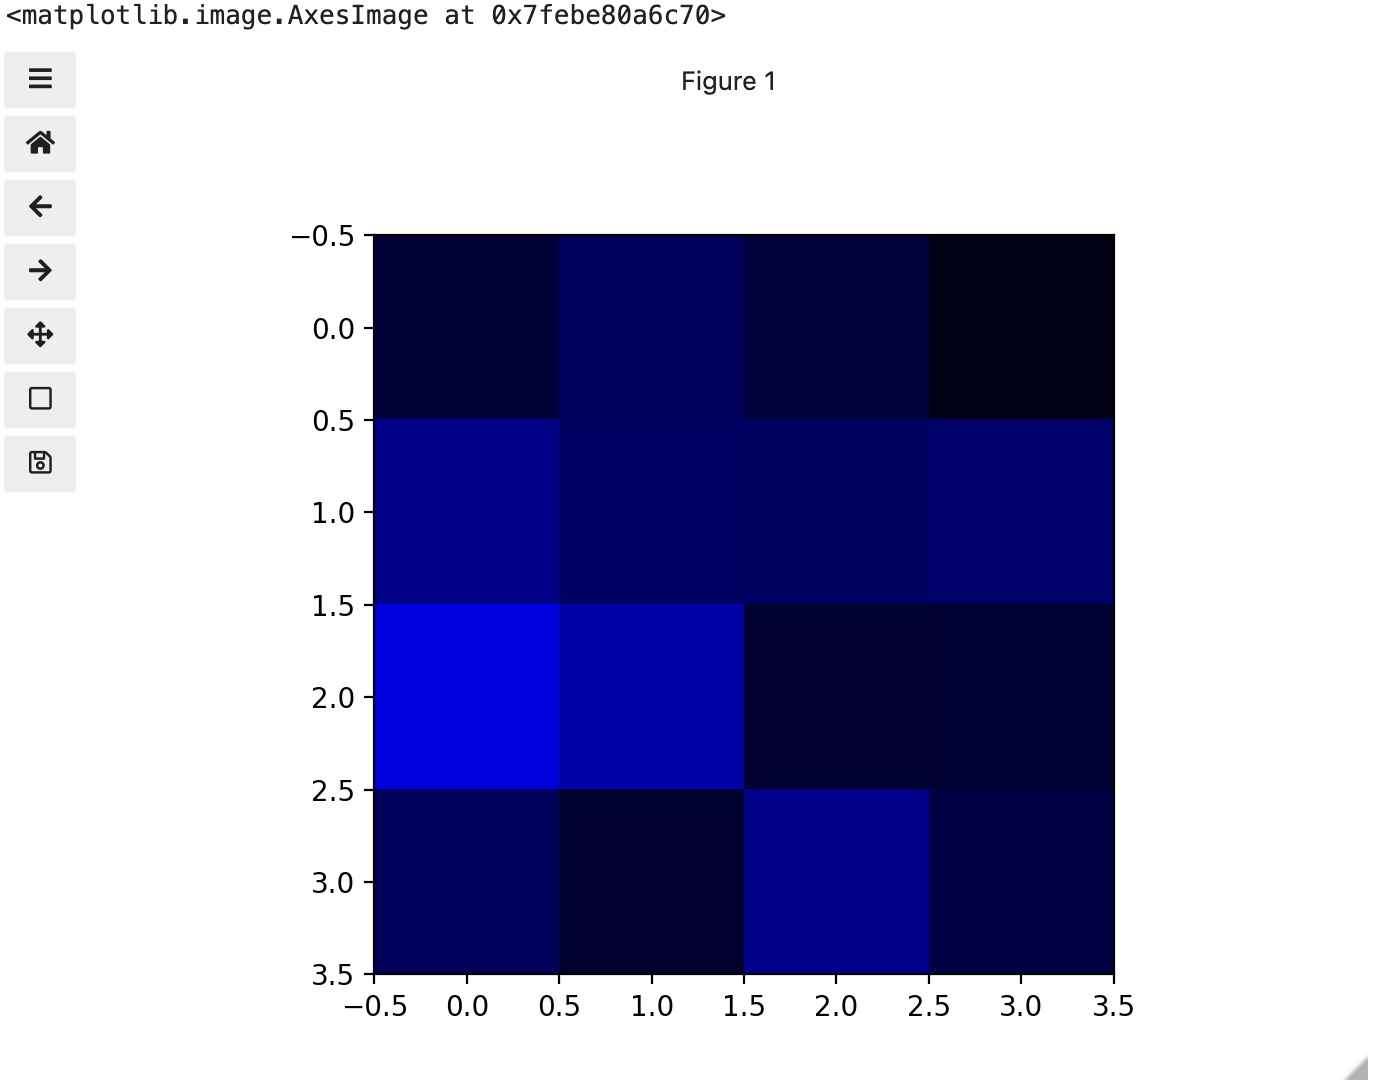
Image 1 of 1: ‘RGB colour table’
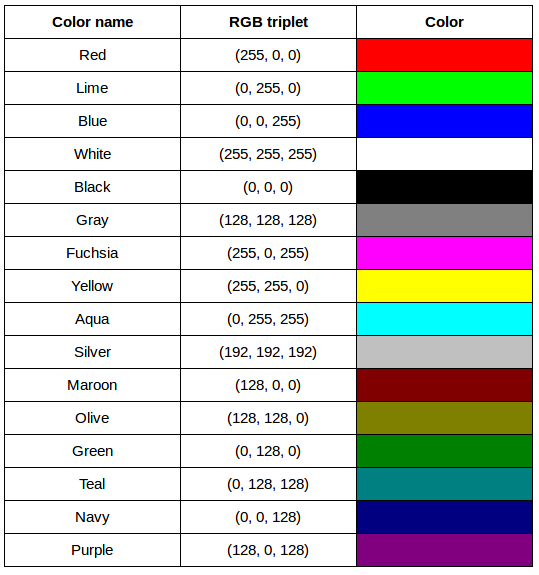
Image 1 of 1: ‘Original image’
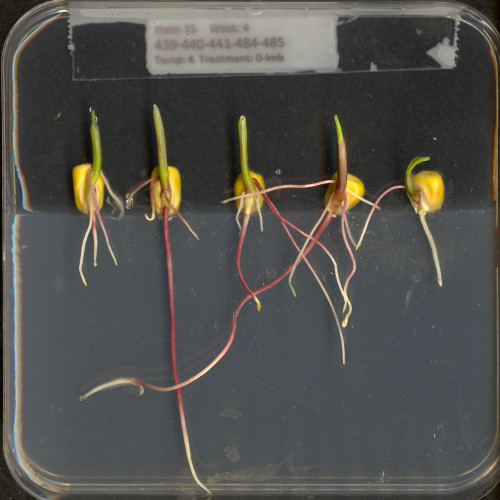
Image 1 of 1: ‘Enlarged, uncompressed’
Image 1 of 1: ‘Enlarged, compressed’
Image 1 of 1: ‘Uncompressed histogram’
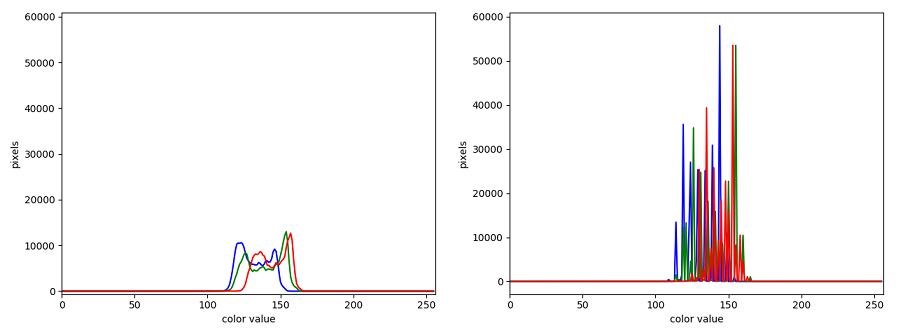
Image 1 of 1: ‘Root cluster image’
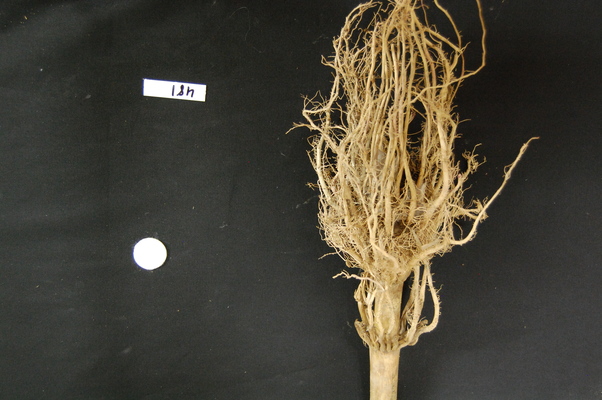
Image 1 of 1: ‘Thresholded root image’
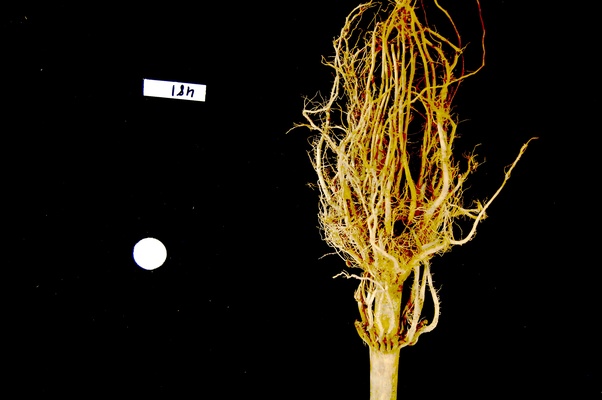
Image 1 of 1: ‘Su-Do-Ku puzzle’
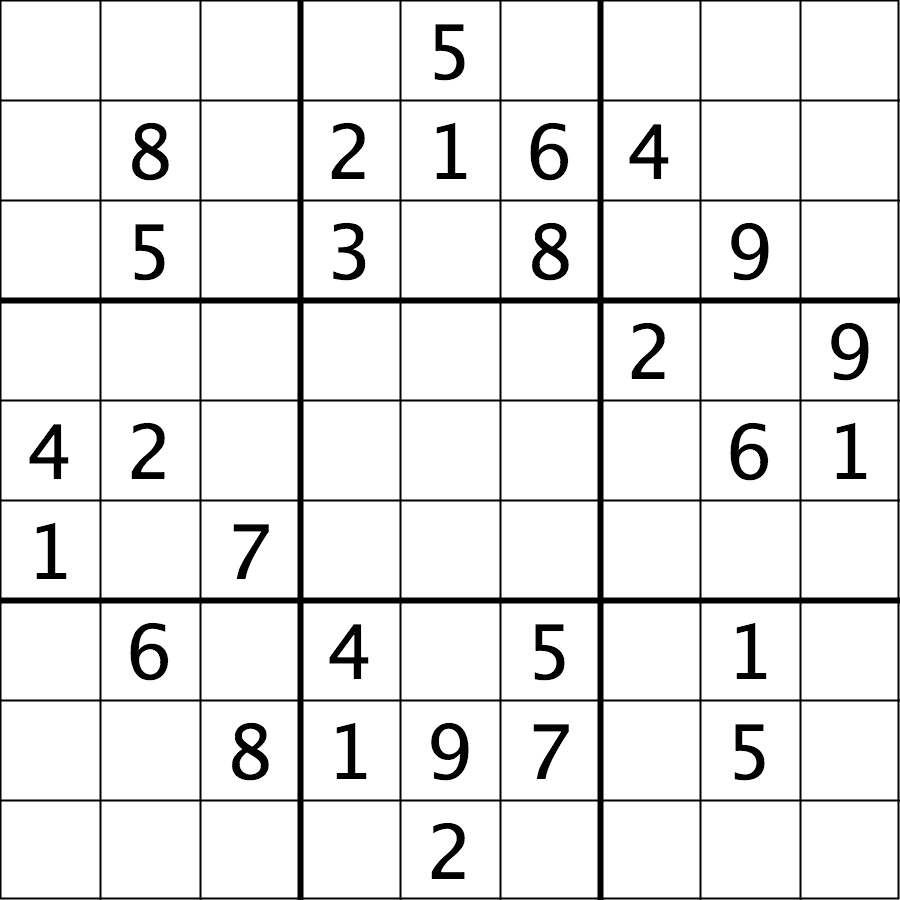
Image 1 of 1: ‘Modified Su-Do-Ku puzzle’
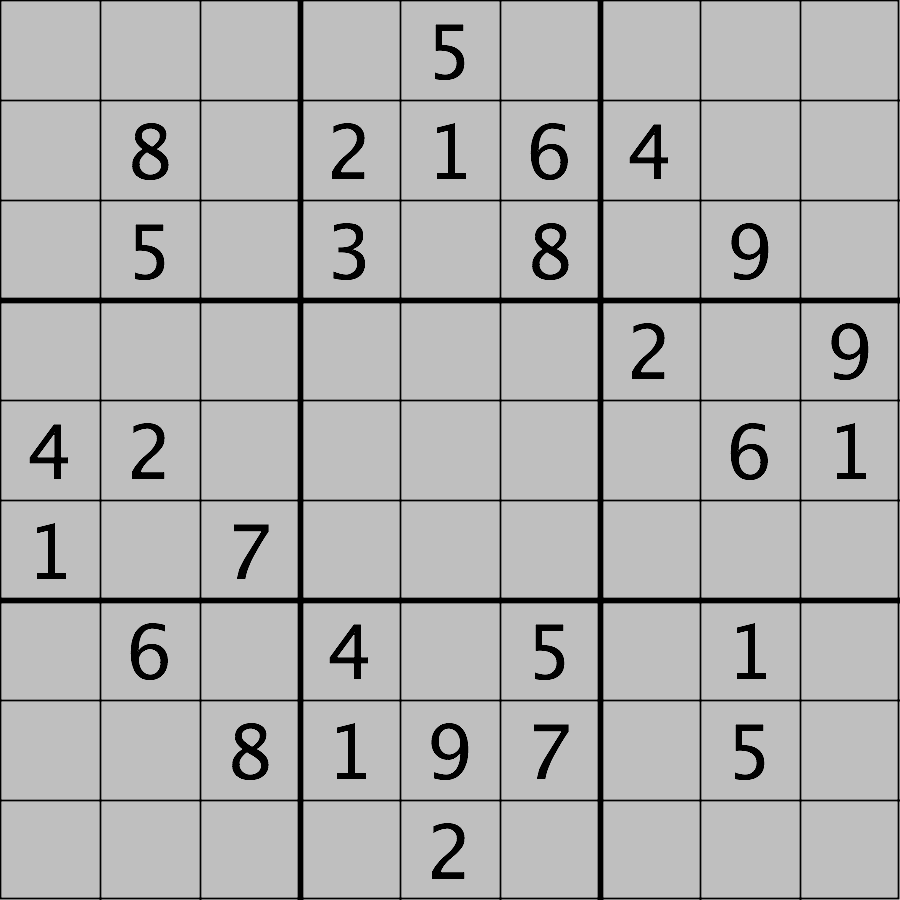
Image 1 of 1: ‘Whiteboard image’
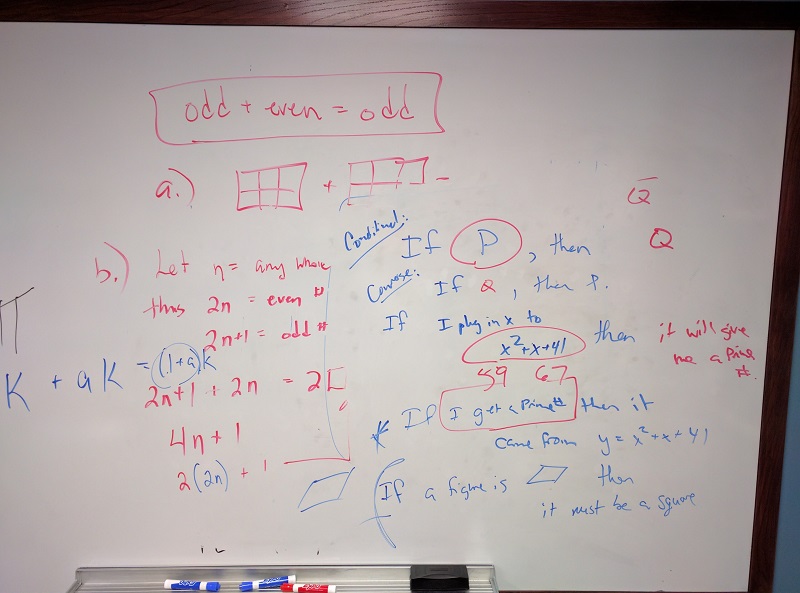
Image 1 of 1: ‘Whiteboard coordinates’
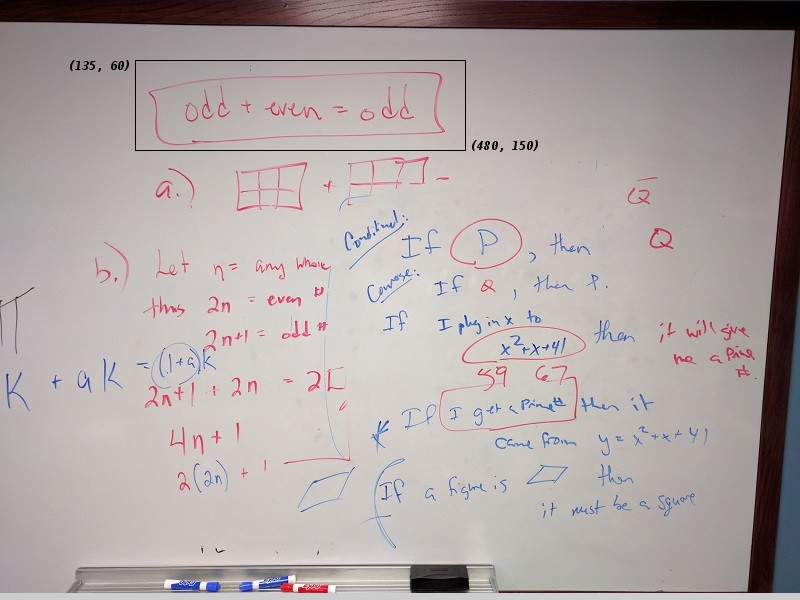
Image 1 of 1: ‘"Erased" whiteboard’
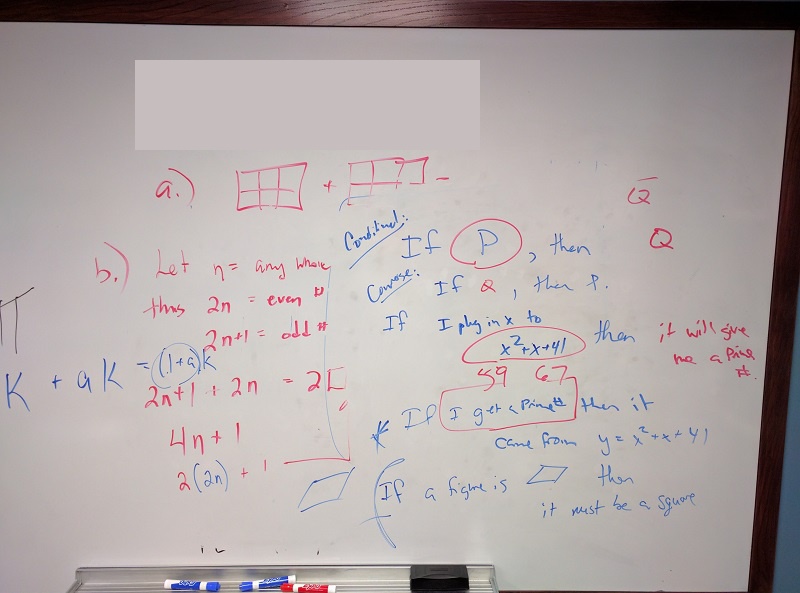
Image 1 of 1: ‘Maize seedlings’
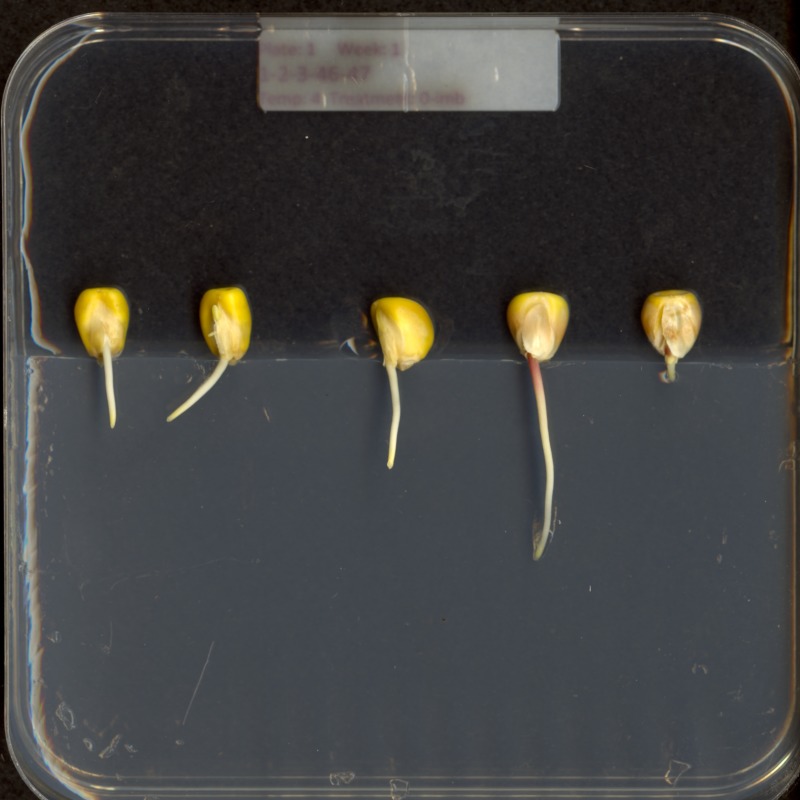
Image 1 of 1: ‘Maize image mask’
Here is what our constructed mask looks like: 
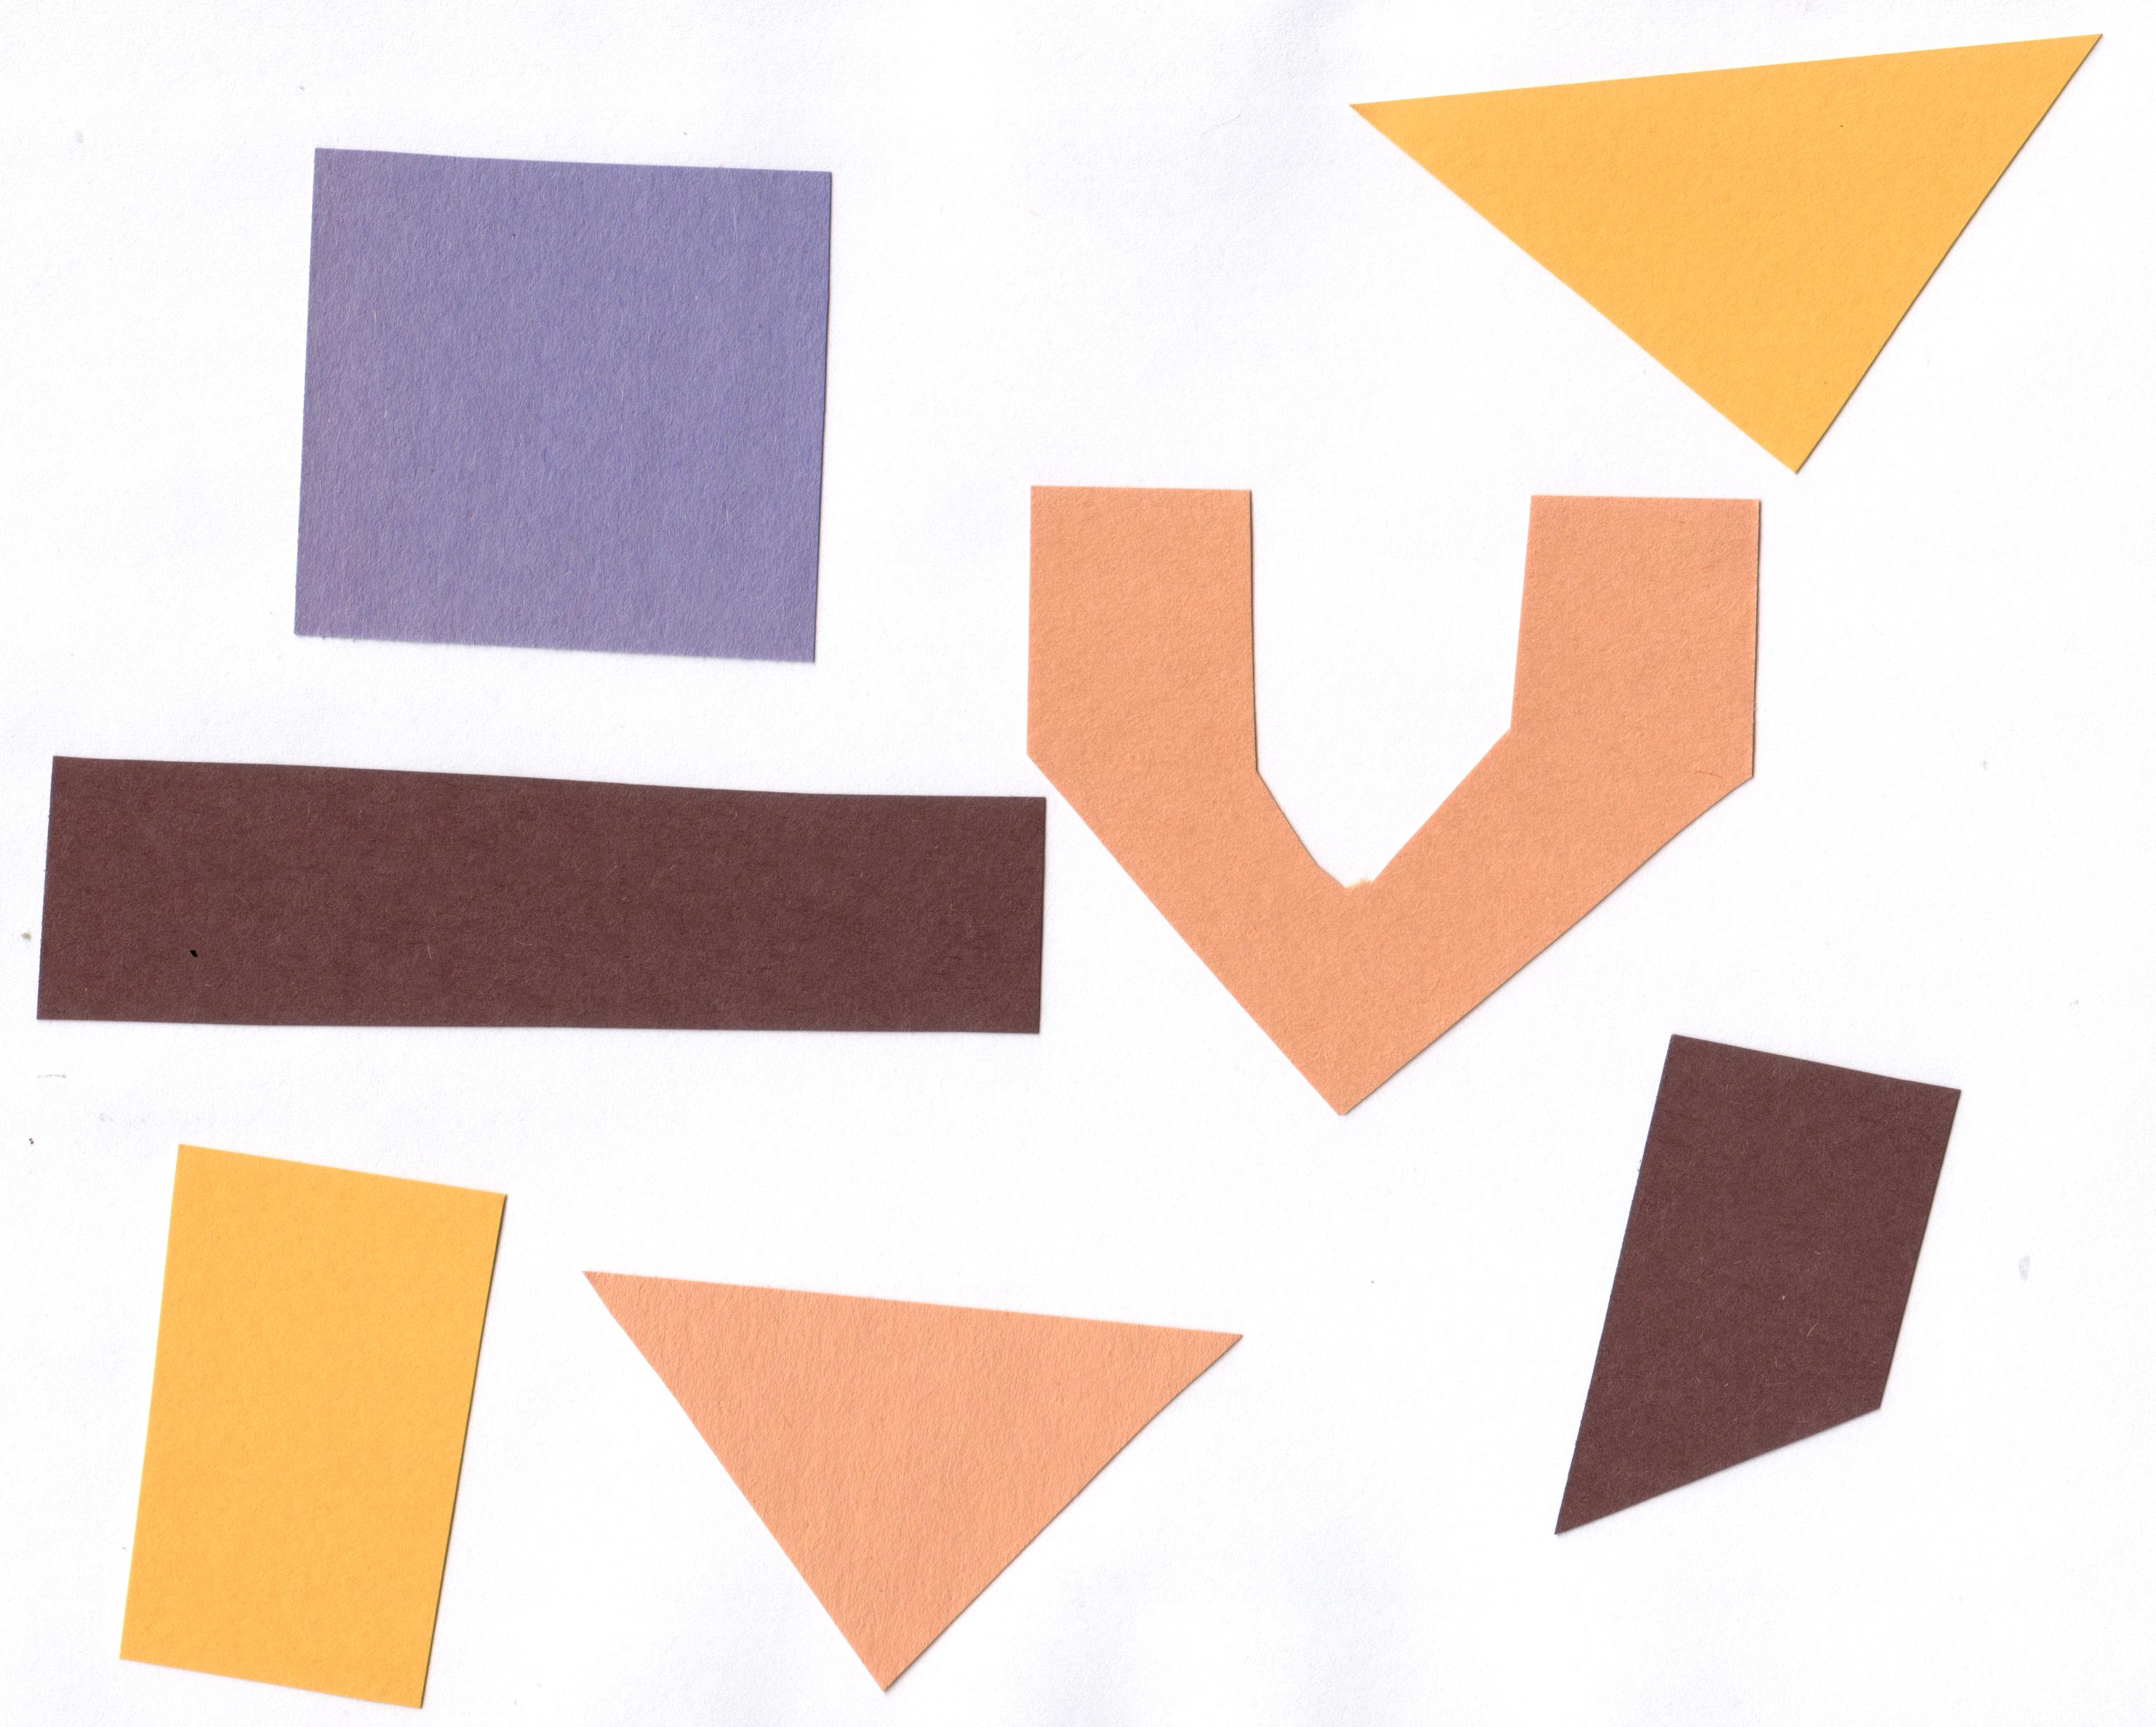
Image 1 of 1: ‘Sample shapes’
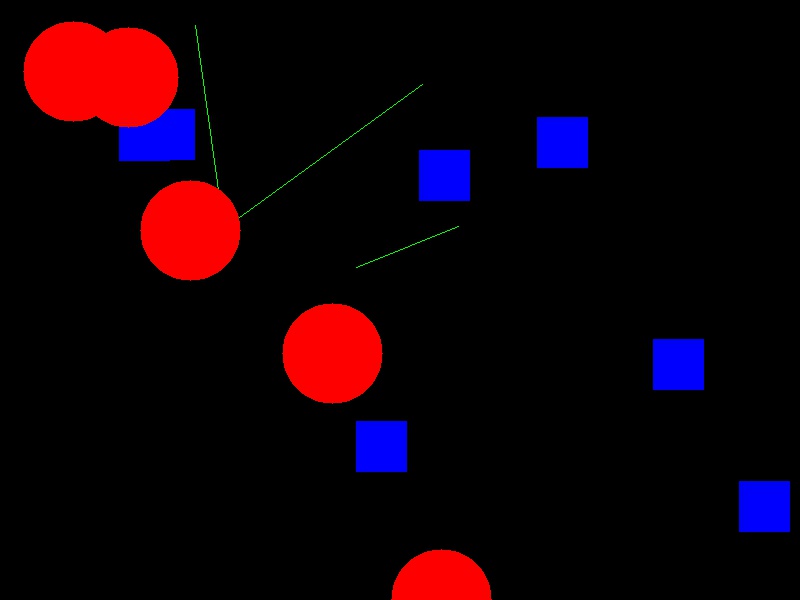
Image 1 of 1: ‘Applied mask’
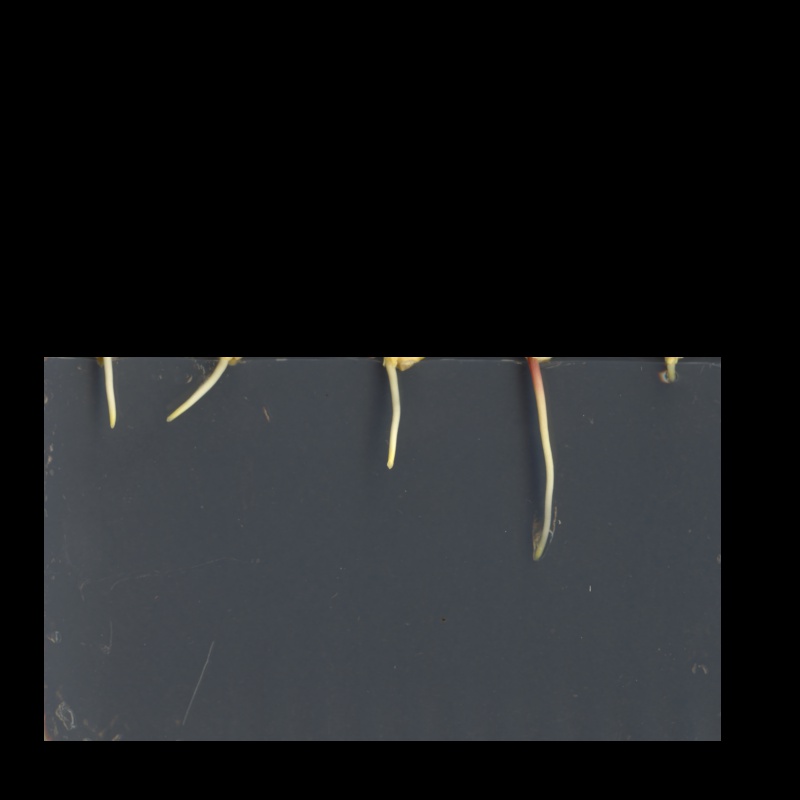
Image 1 of 1: ‘Remote control image’
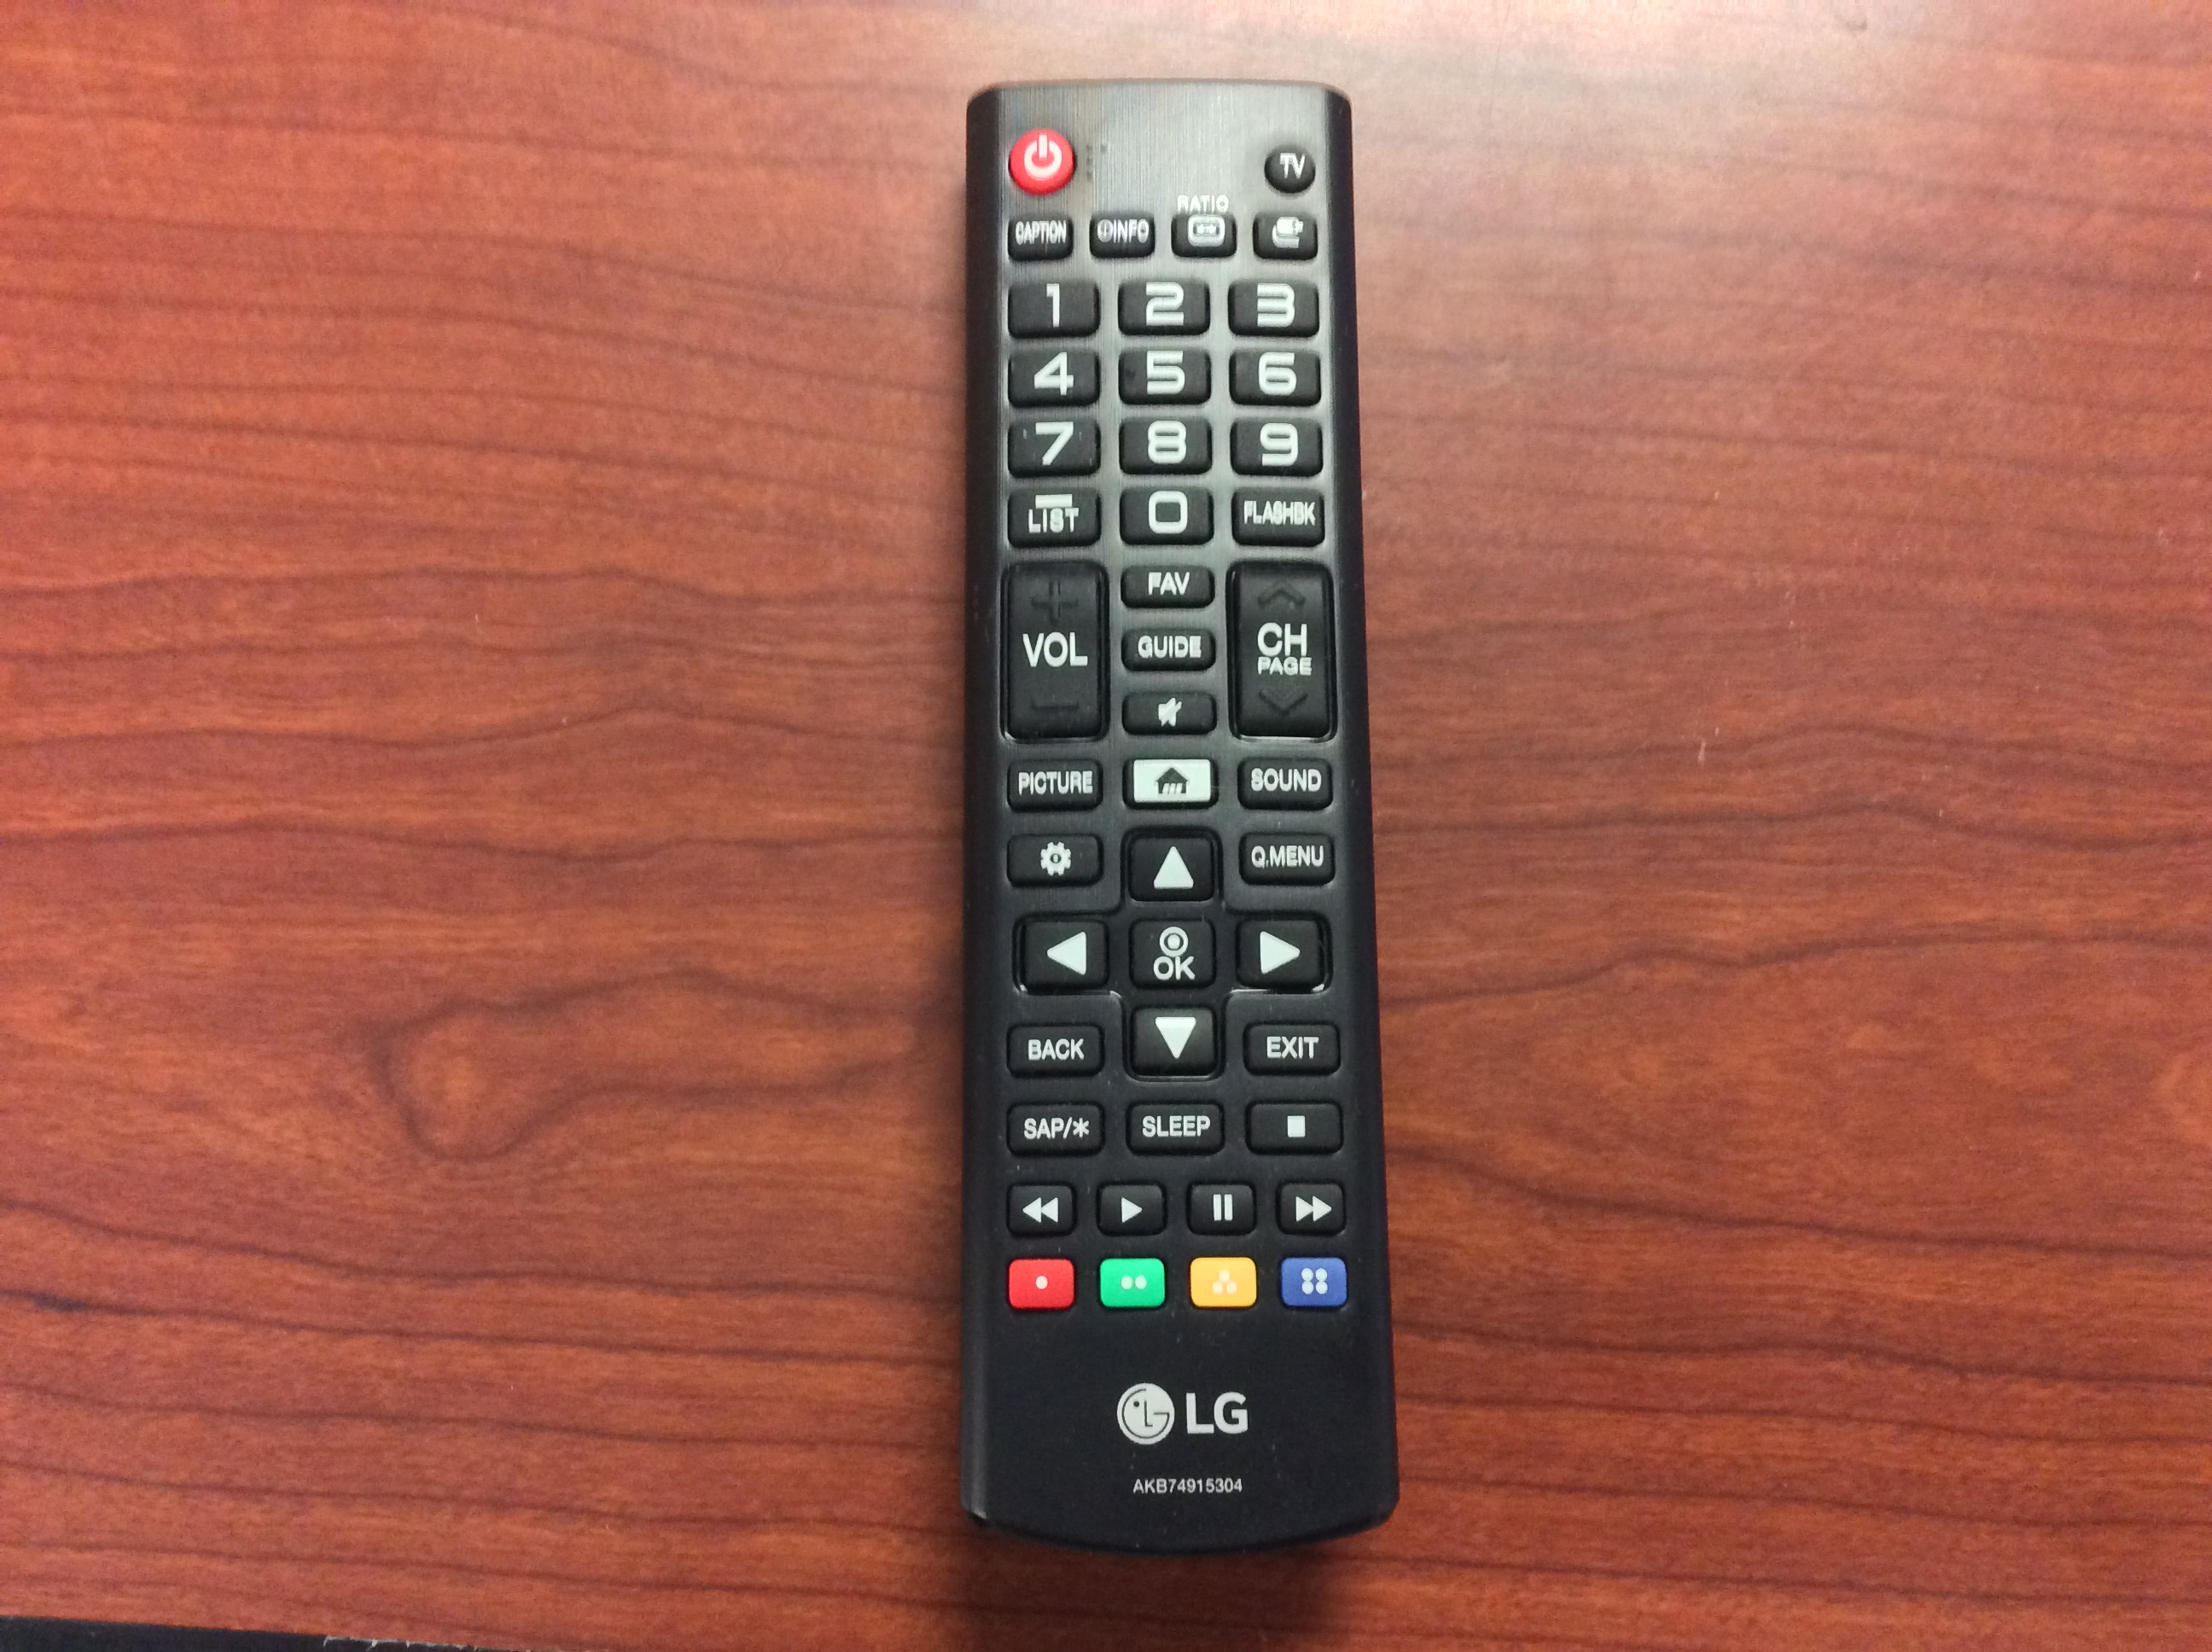
Image 1 of 1: ‘Remote control masked’
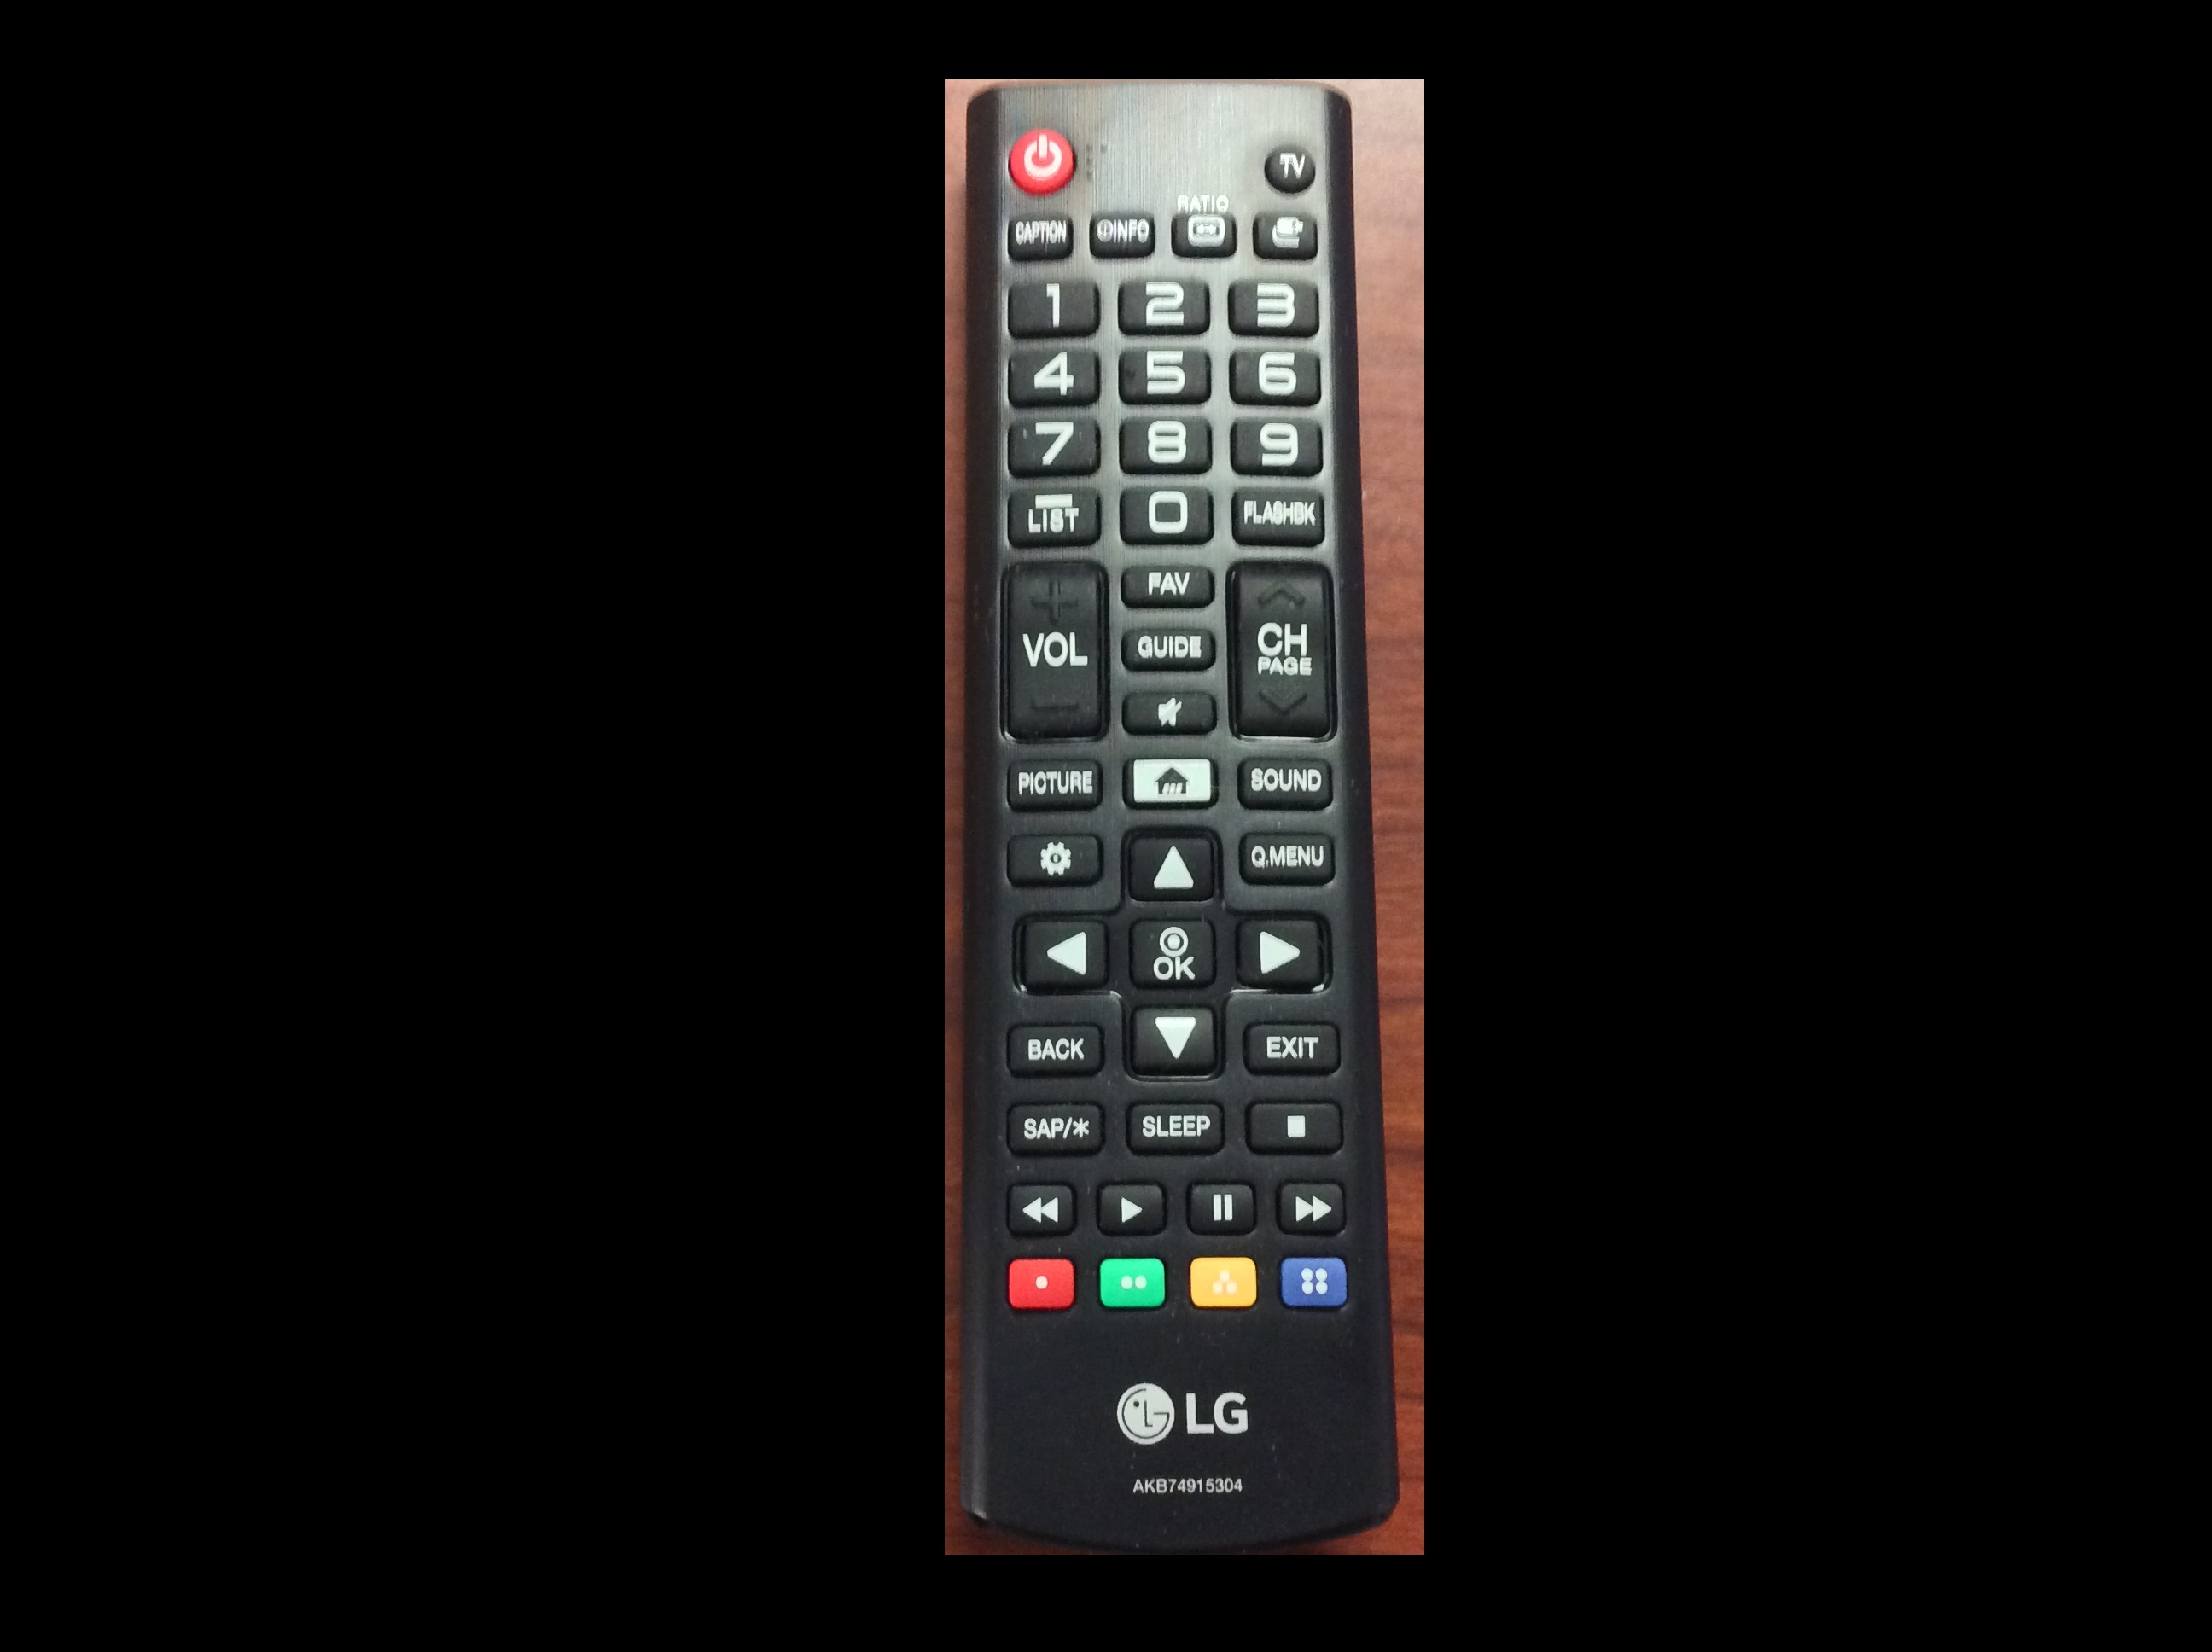
Image 1 of 1: ‘96-well plate’
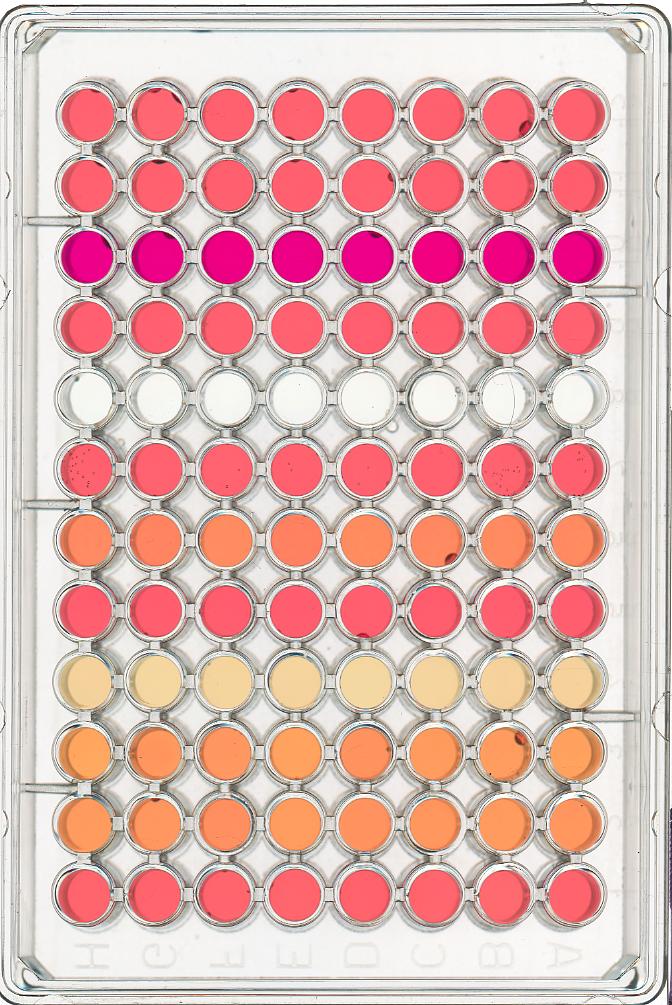
Image 1 of 1: ‘Masked 96-well plate’
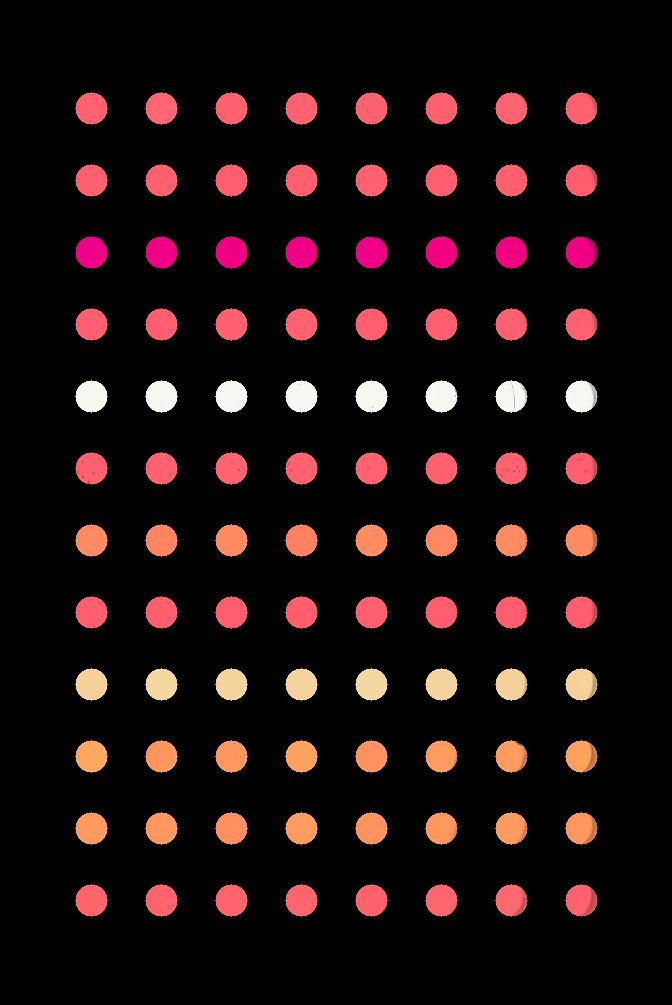
Image 1 of 1: ‘Plant seedling’
We will start with grayscale images, and then move on to colour
images. We will use this image of a plant seedling as an example: 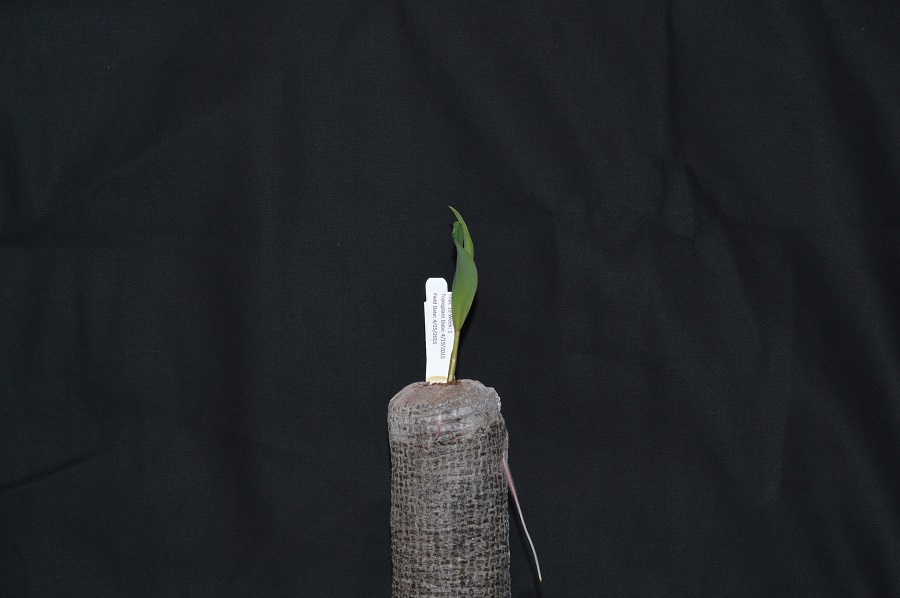
Image 1 of 1: ‘Plant seedling’
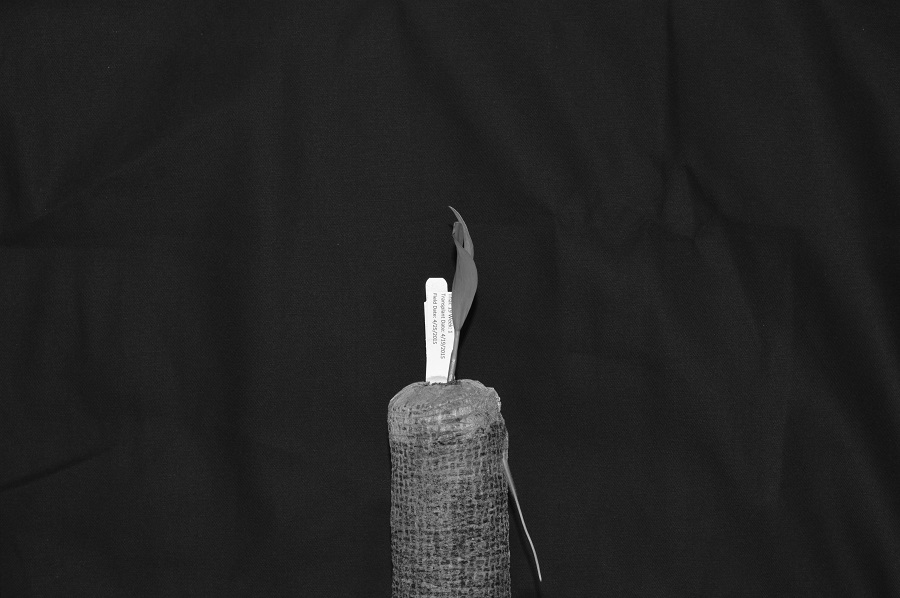
Image 1 of 1: ‘Plant seedling histogram’
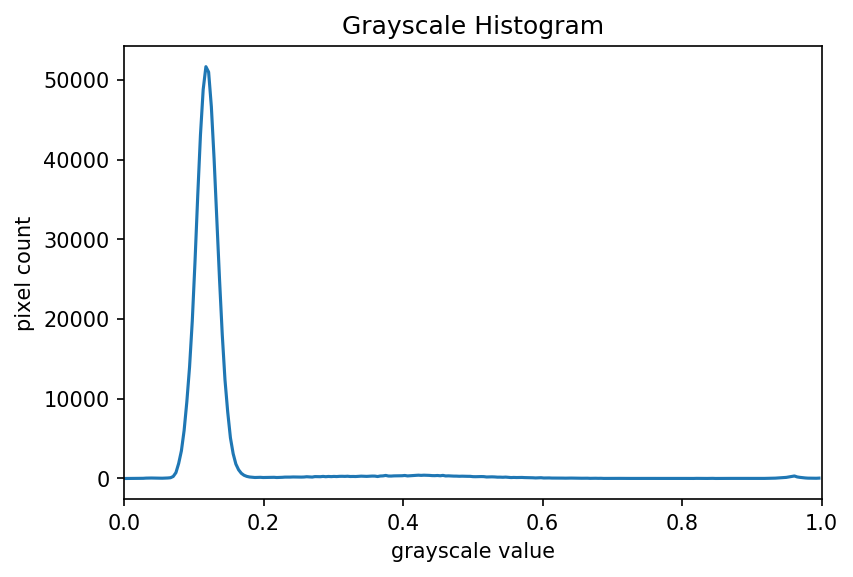
Image 1 of 1: ‘Grayscale histogram of masked area’
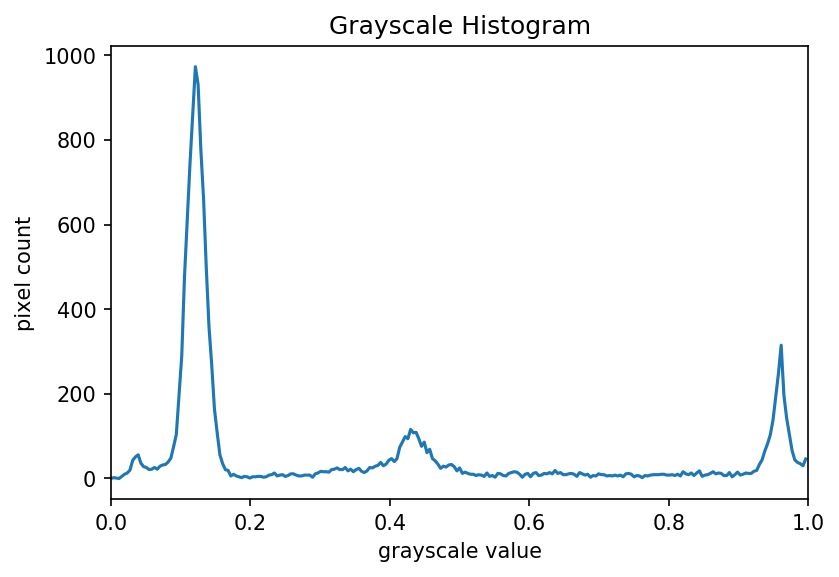
Image 1 of 1: ‘Colour histogram’
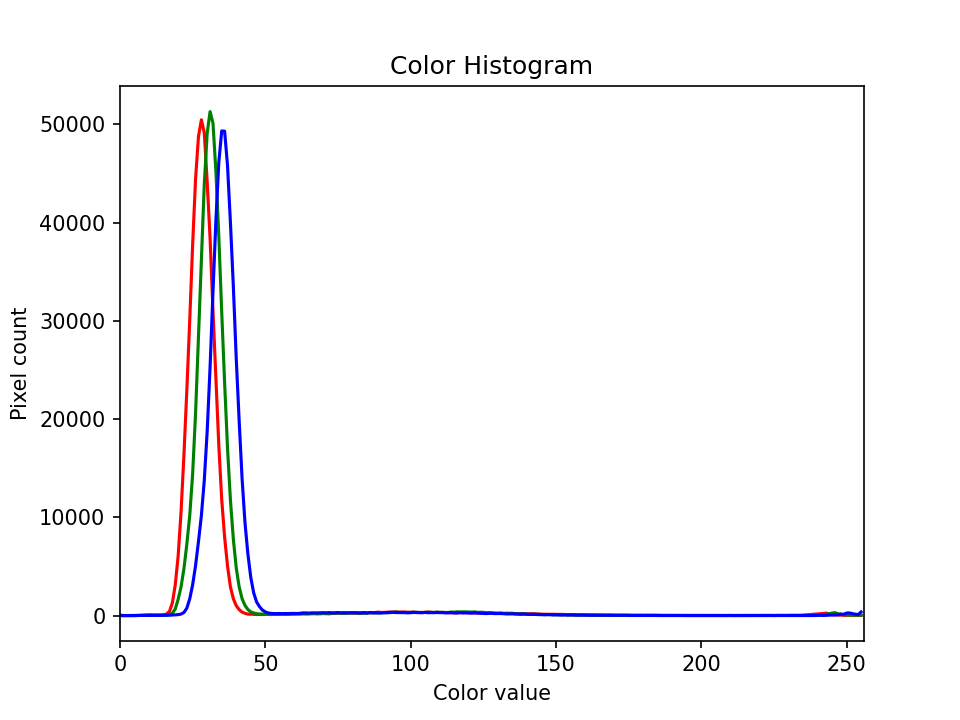
Image 1 of 1: ‘Well plate image’
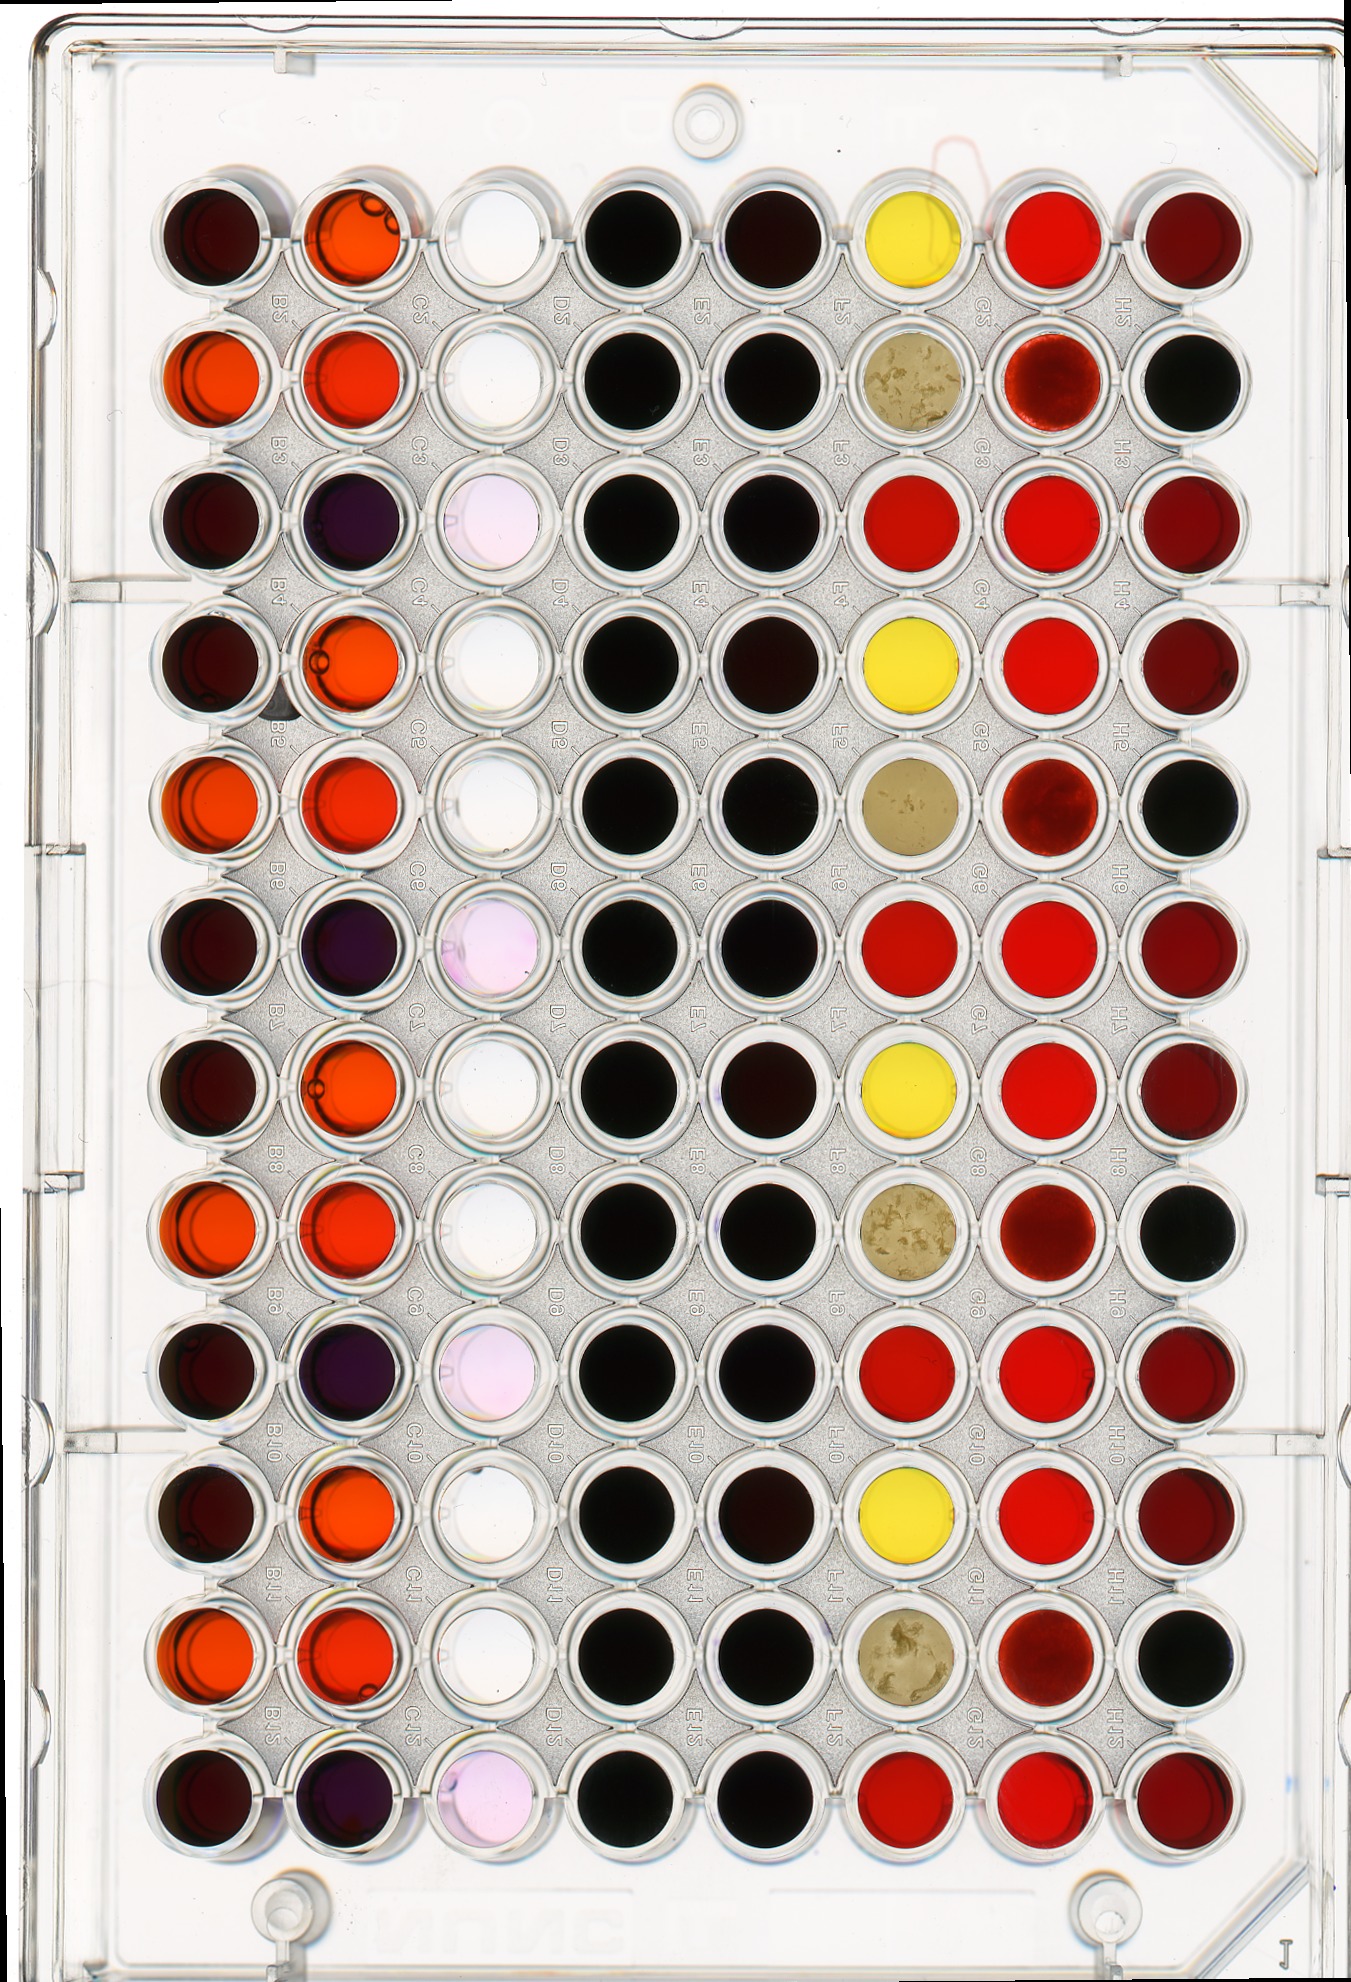
Image 1 of 1: ‘Masked well plate’
Image 1 of 1: ‘Well plate histogram’
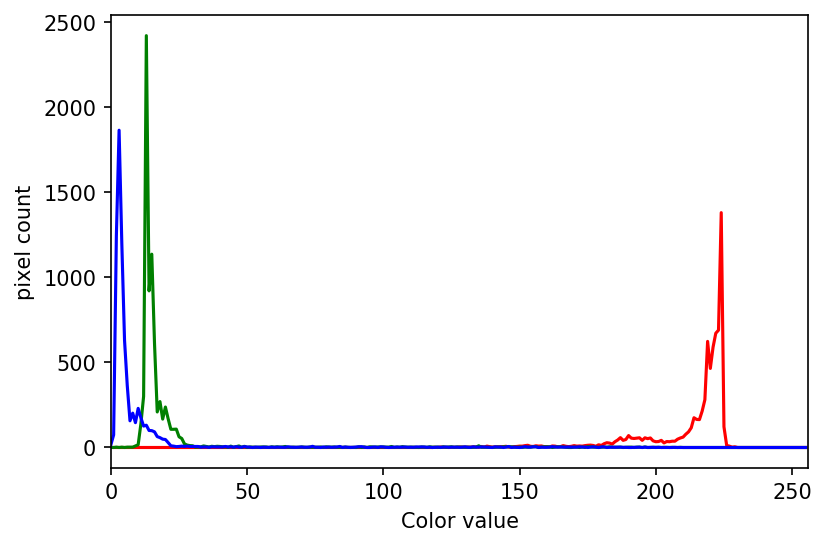
Image 1 of 1: ‘Cat image’
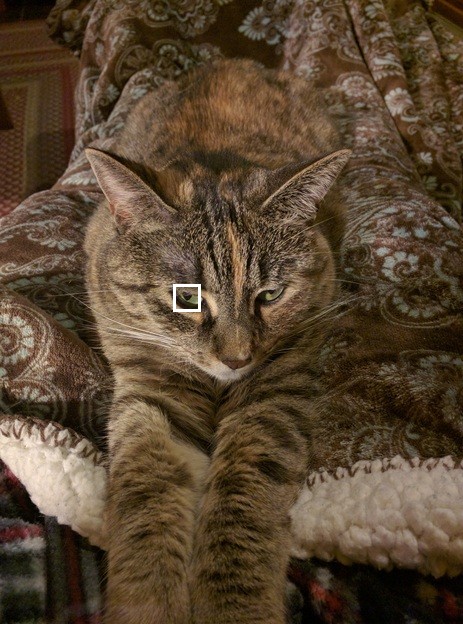
Image 1 of 1: ‘Cat eye pixels’
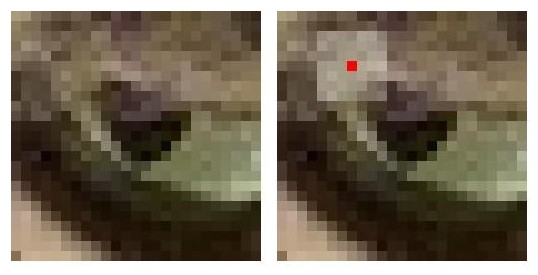
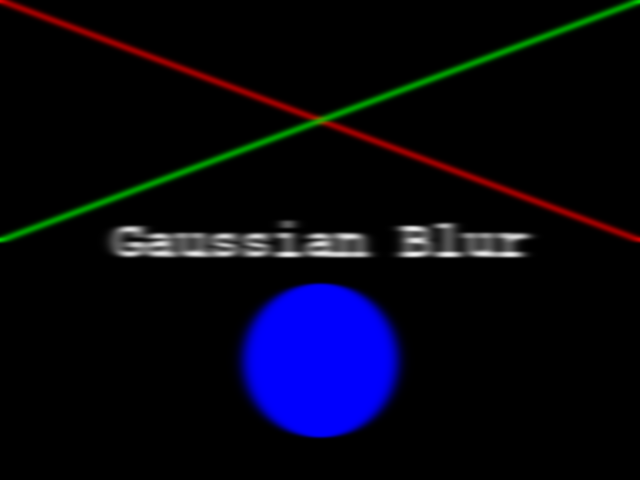
Image 1 of 1: ‘Gaussian function’
A Gaussian function maps random variables into a normal distribution
or “Bell Curve”. 
Image 1 of 1: ‘2D Gaussian function’
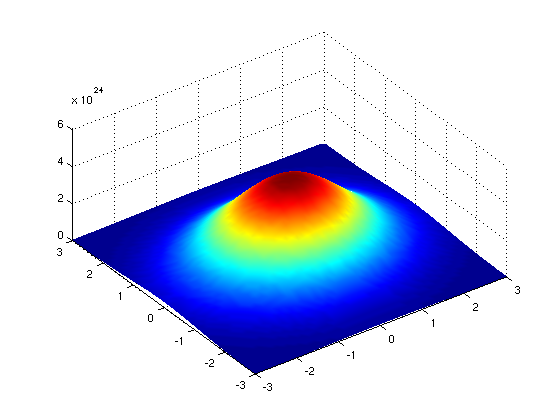
Image 1 of 1: ‘2D Gaussian function’
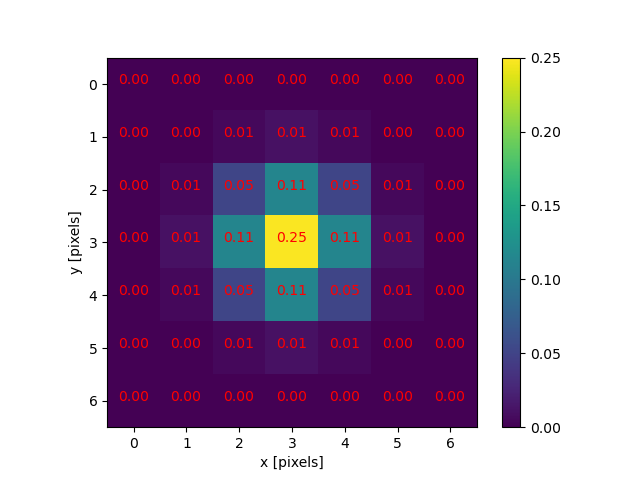
Image 1 of 1: ‘Image corner pixels’
Image 1 of 1: ‘Image multiplication’
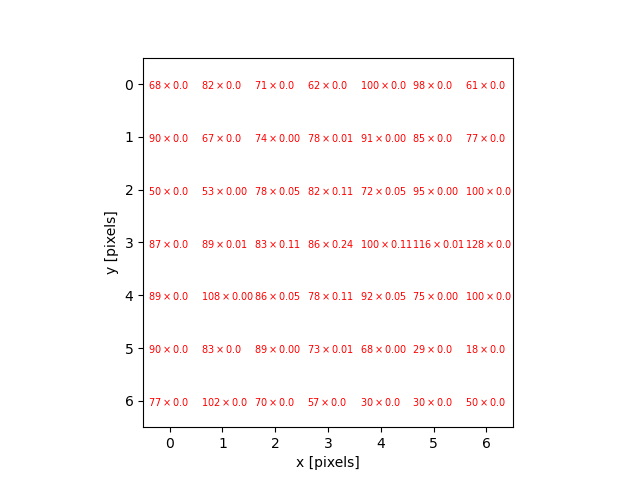
Image 1 of 1: ‘Blur demo animation’
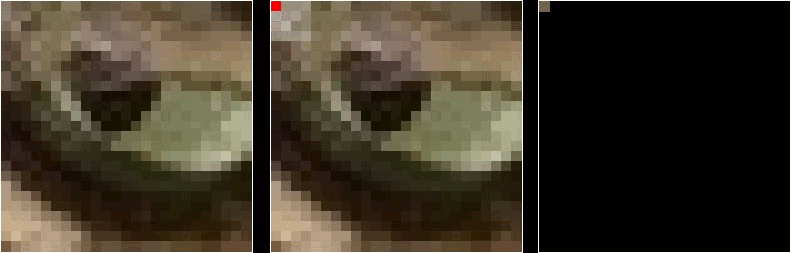
Image 1 of 1: ‘Original image’
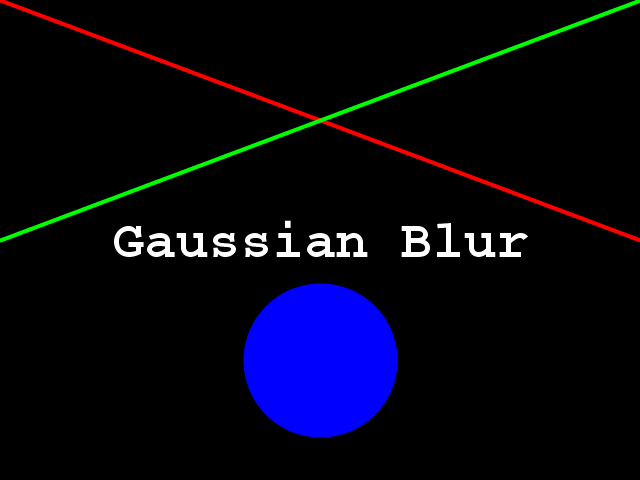
Image 1 of 1: ‘Original image’
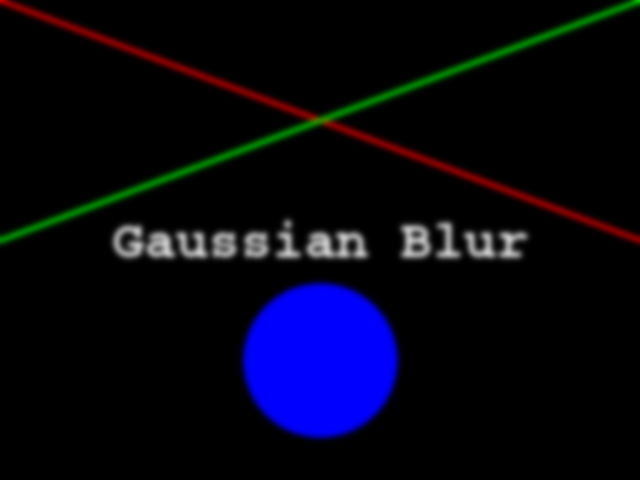
Image 1 of 1: ‘Rectangular kernel blurred image’
 {alt=‘Image with geometric shapes on
white background’ .image-with-shadow}
{alt=‘Image with geometric shapes on
white background’ .image-with-shadow}
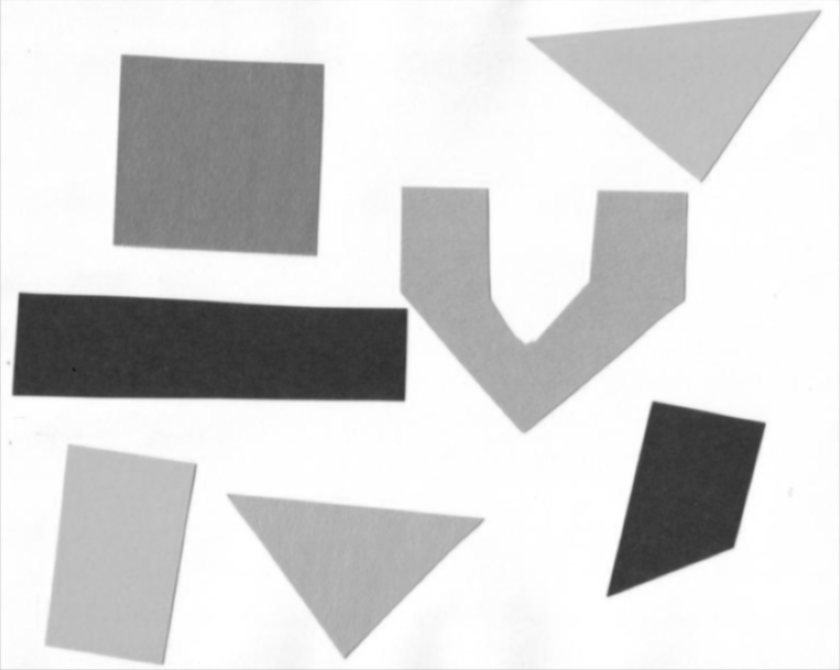 {alt=‘Grayscale image of
the geometric shapes’ .image-with-shadow}
{alt=‘Grayscale image of
the geometric shapes’ .image-with-shadow}
Image 1 of 1: ‘Grayscale histogram of the geometric shapes image’
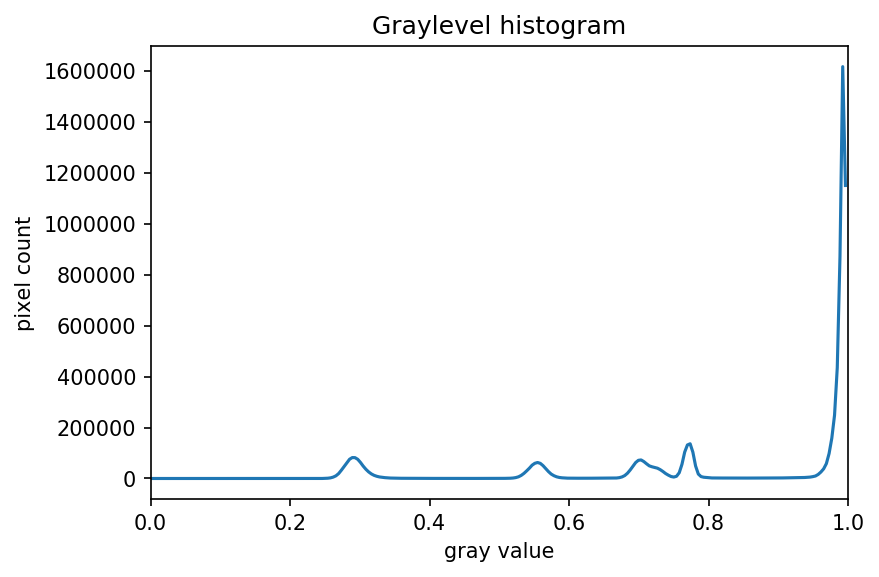
Image 1 of 1: ‘Binary mask of the geometric shapes created by thresholding’
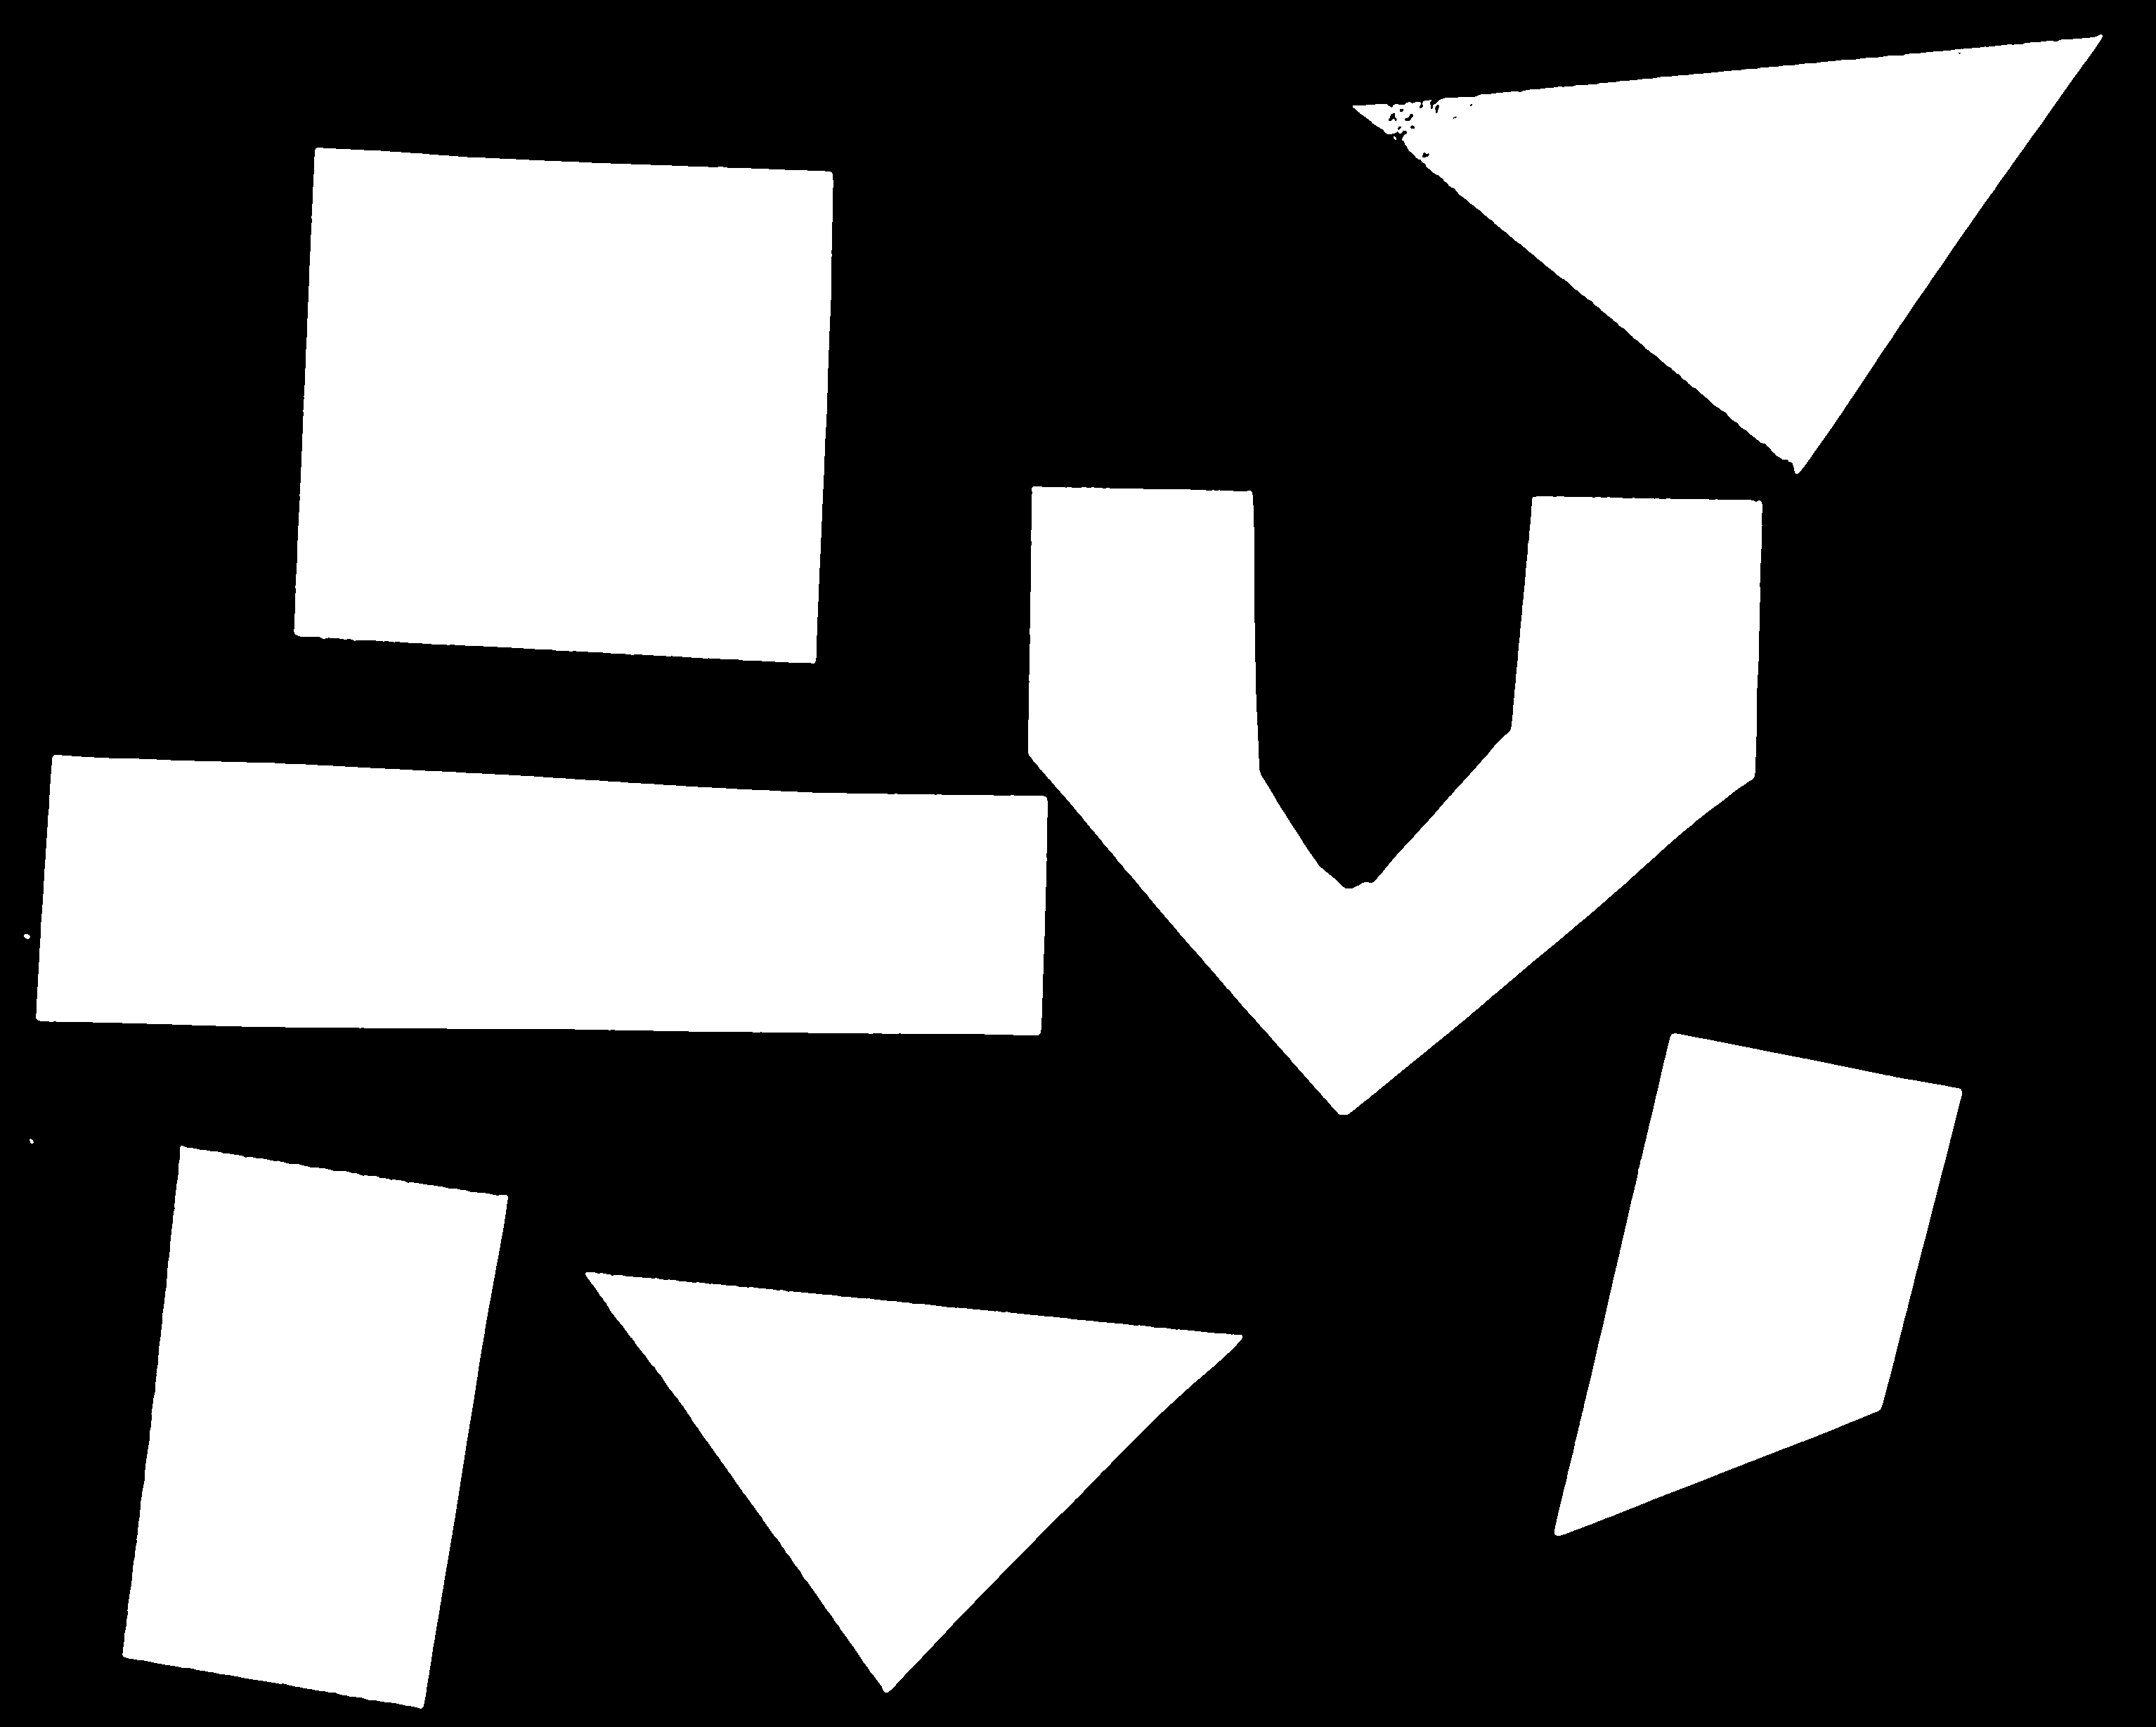
Image 1 of 1: ‘Selected shapes after applying binary mask’
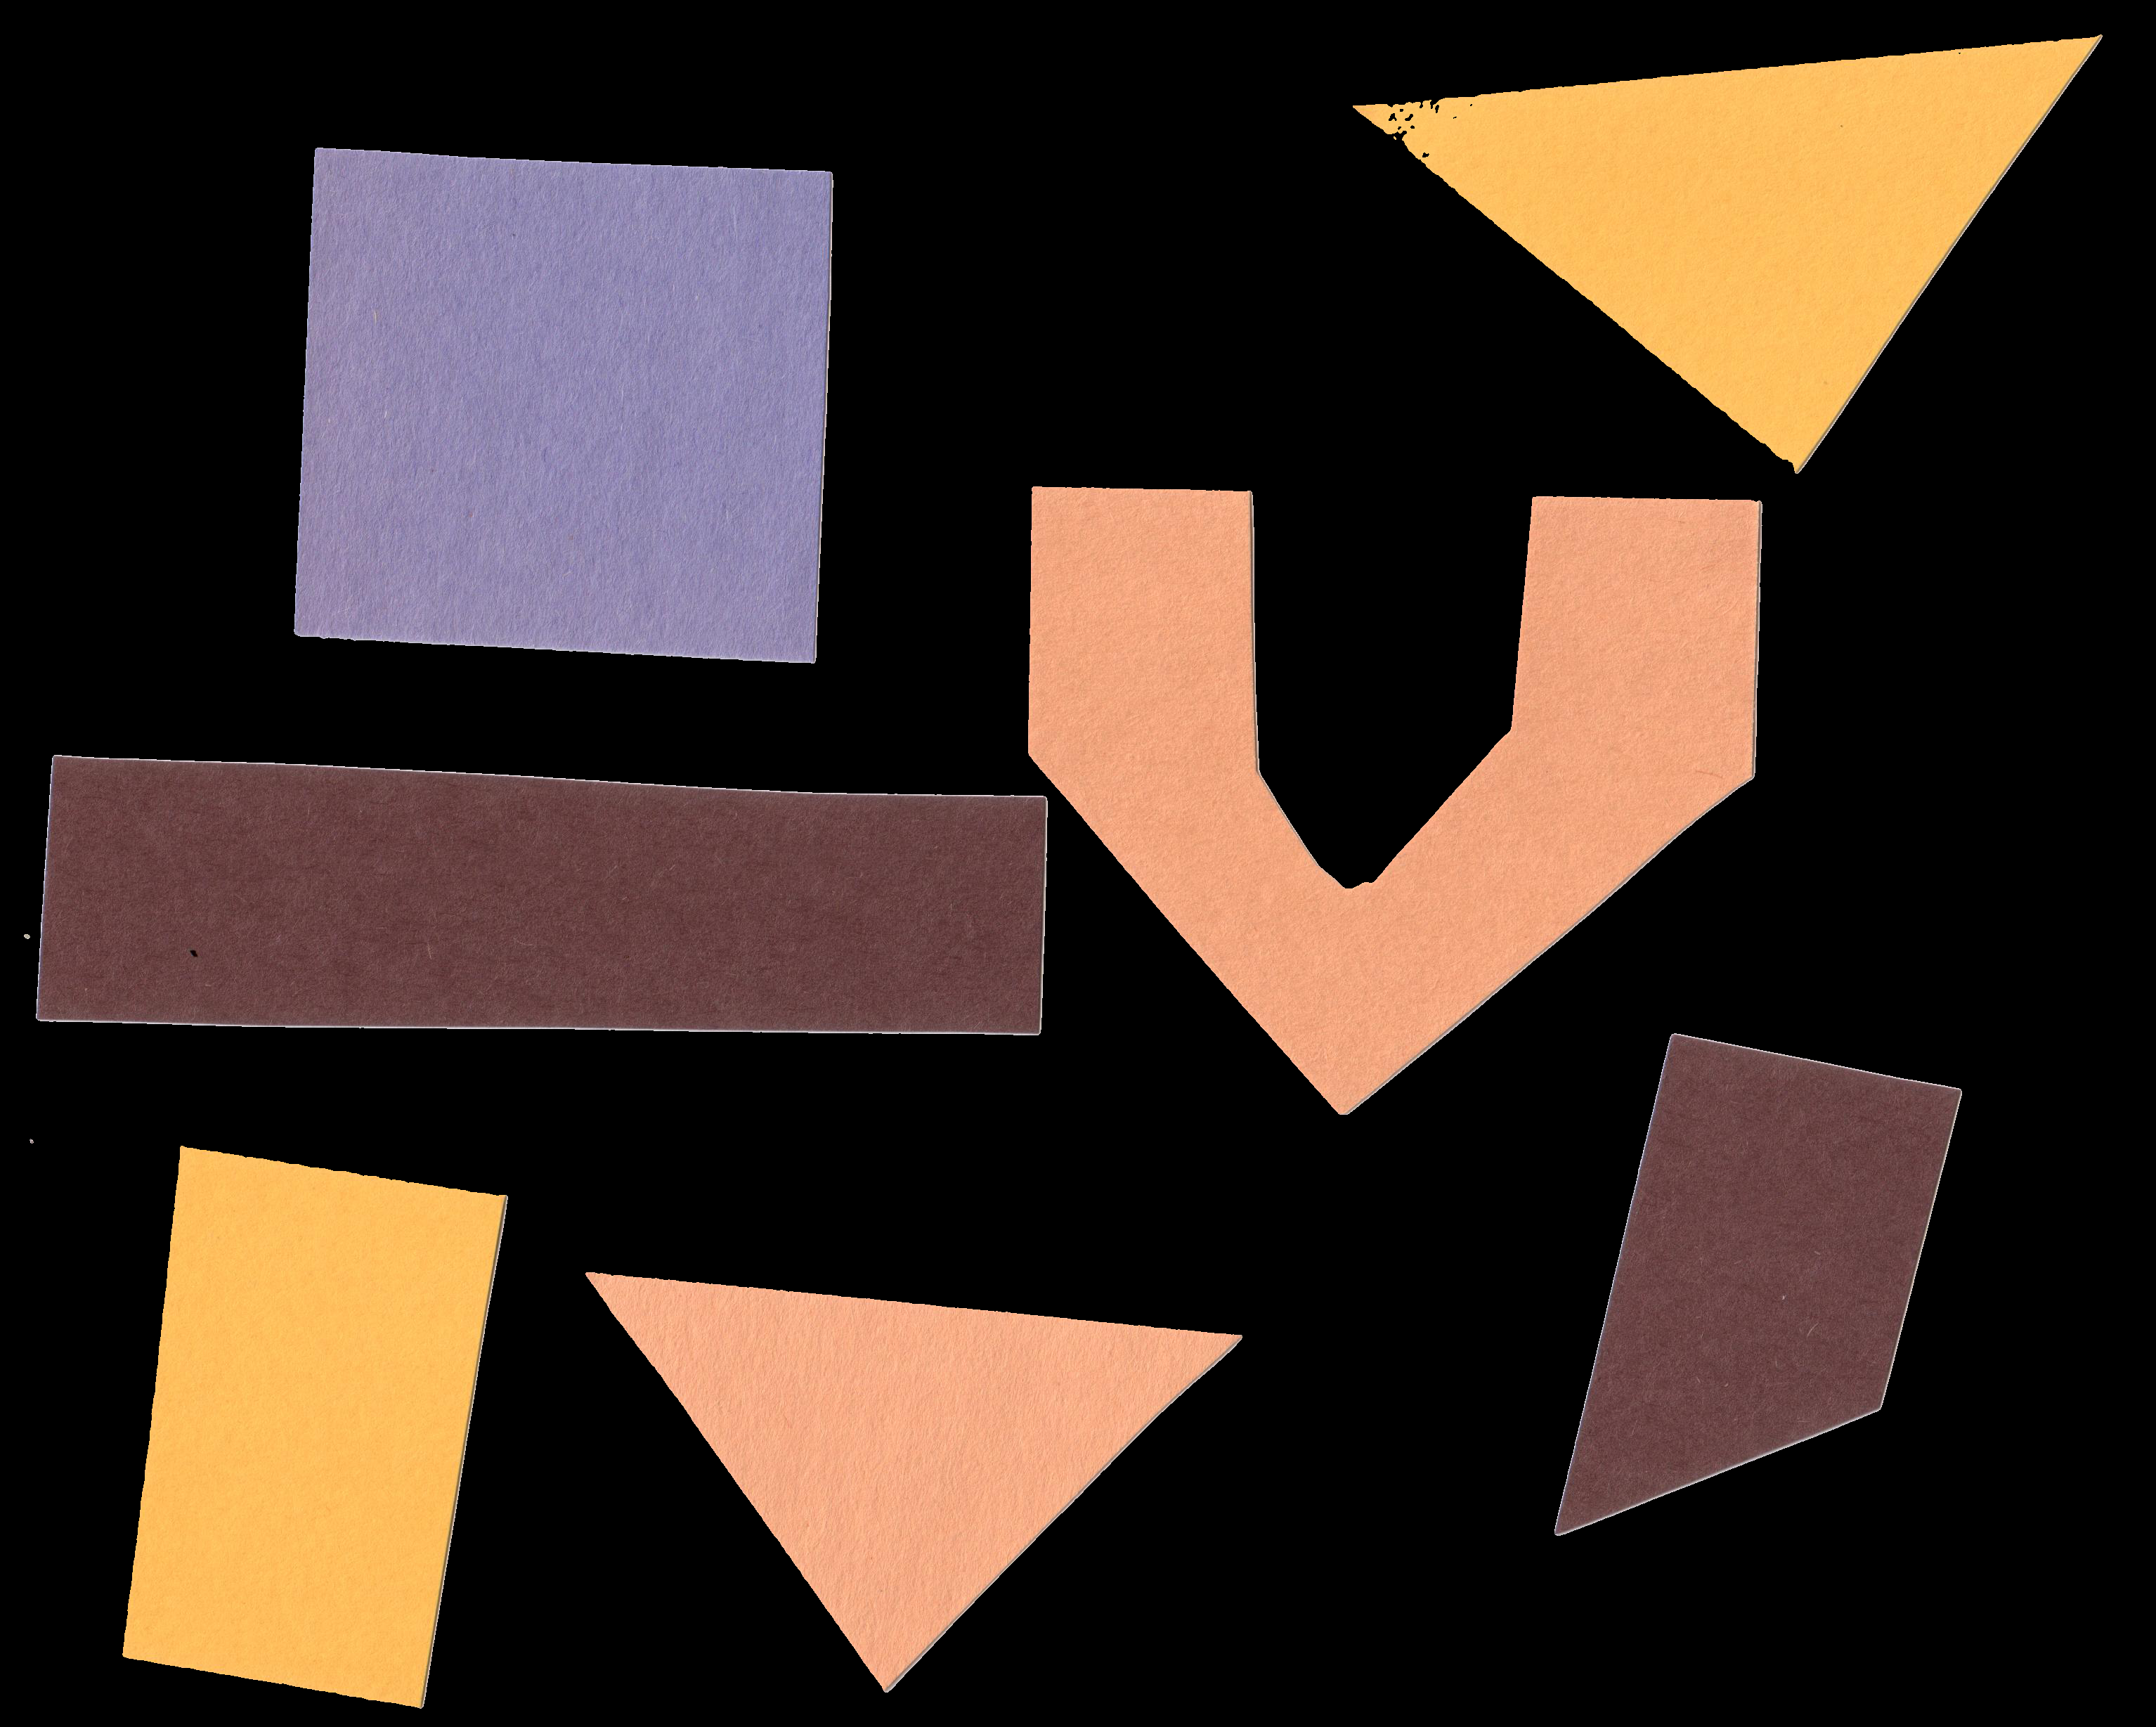
Image 1 of 1: ‘Another image with geometric shapes on white background’
Image 1 of 1: ‘Grayscale histogram of the second geometric shapes image’
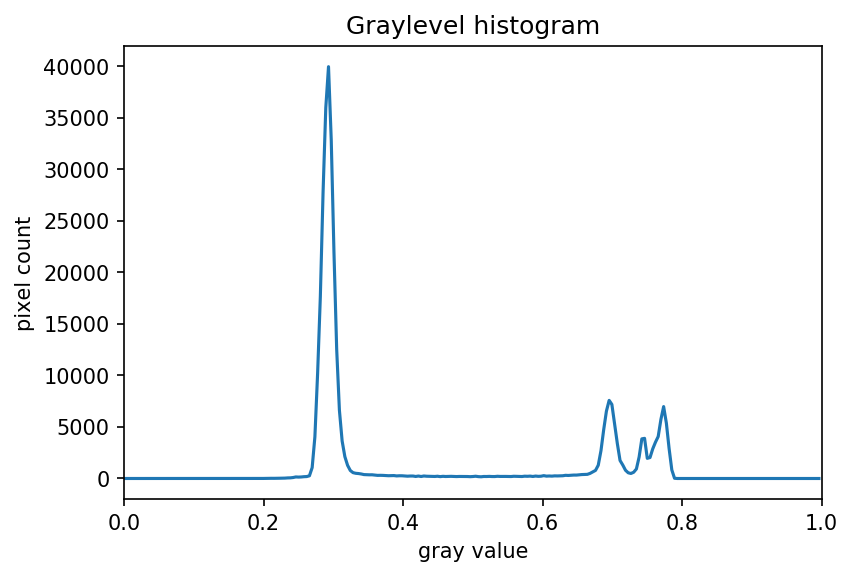
Image 1 of 1: ‘Binary mask created by thresholding the second geometric shapes image’

Image 1 of 1: ‘Selected shapes after applying binary mask to the second geometric shapes image’
Image 1 of 1: ‘Image of a maize root’
Image 1 of 1: ‘Grayscale histogram of the maize root image’
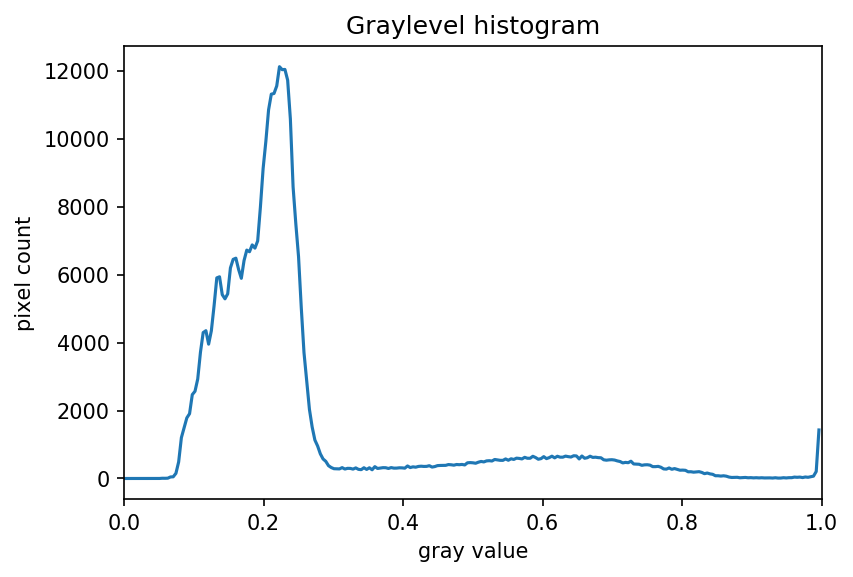
Image 1 of 1: ‘Binary mask of the maize root system’
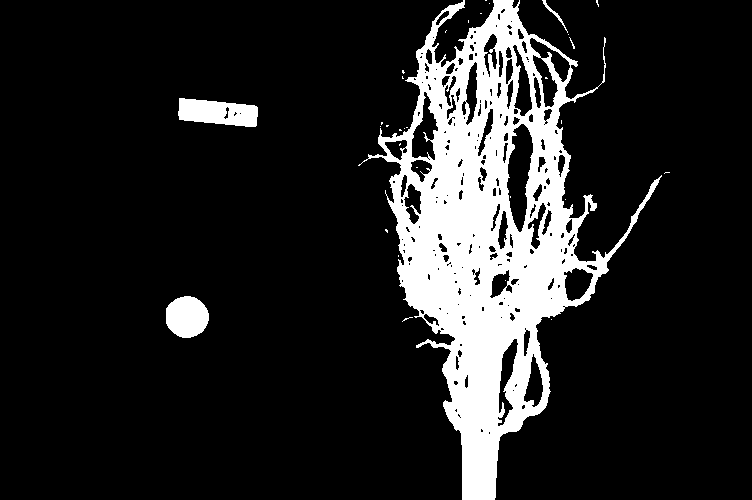
Image 1 of 1: ‘Masked selection of the maize root system’
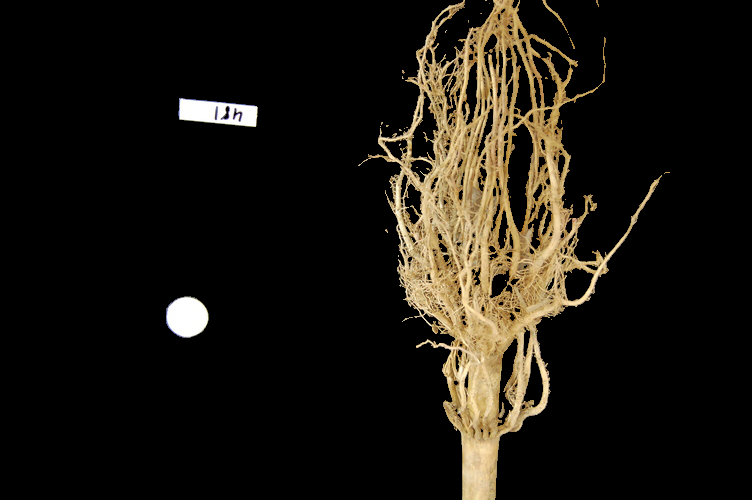
Image 1 of 1: ‘Four images of maize roots’
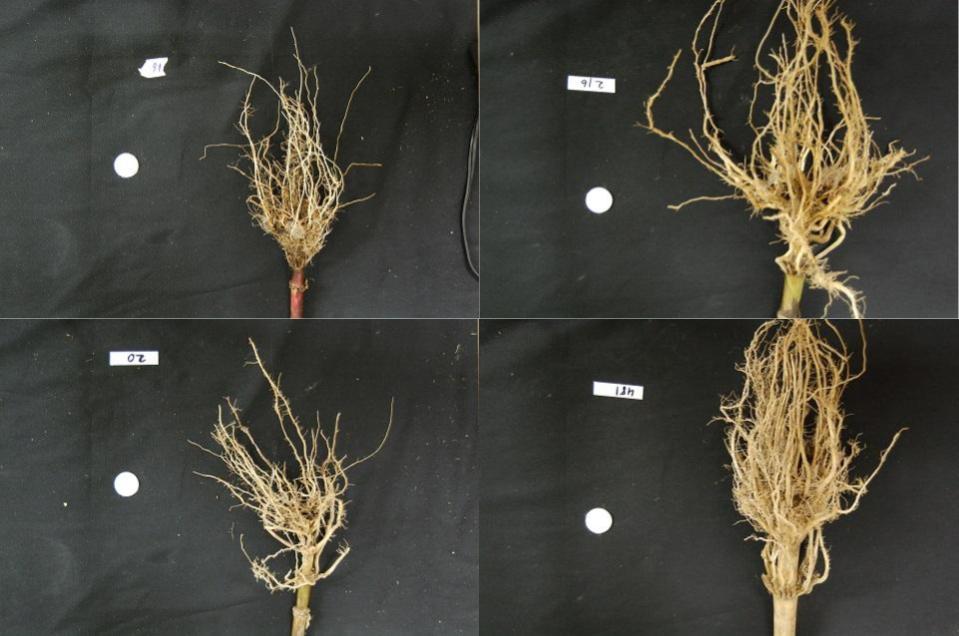
Image 1 of 1: ‘Binary masks of the four maize root images’

Image 1 of 1: ‘Improved binary masks of the four maize root images’
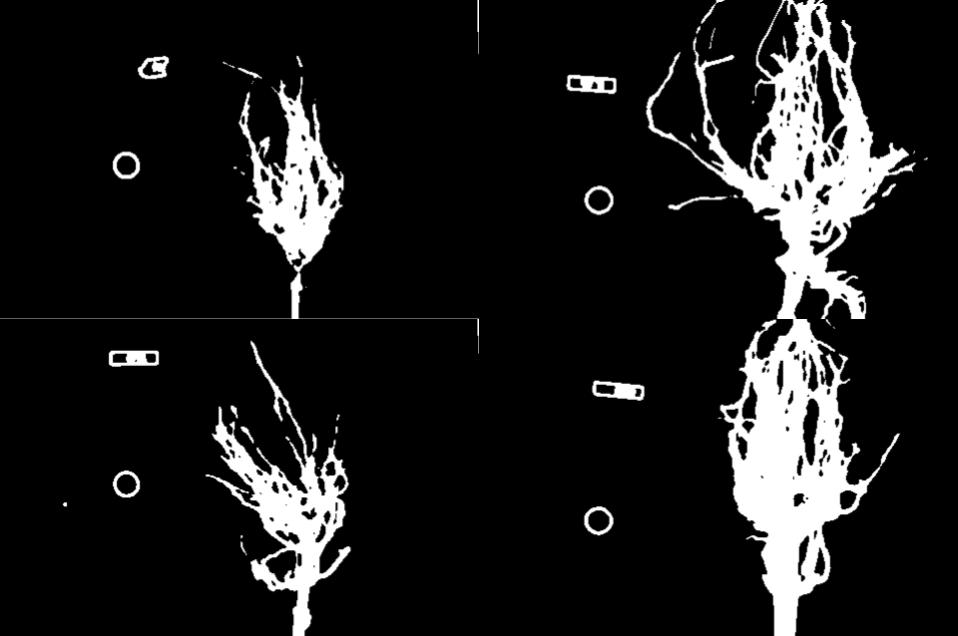
Image 1 of 1: ‘Image of bacteria colonies in a petri dish’
Image 1 of 1: ‘Grayscale histogram of the bacteria colonies image’
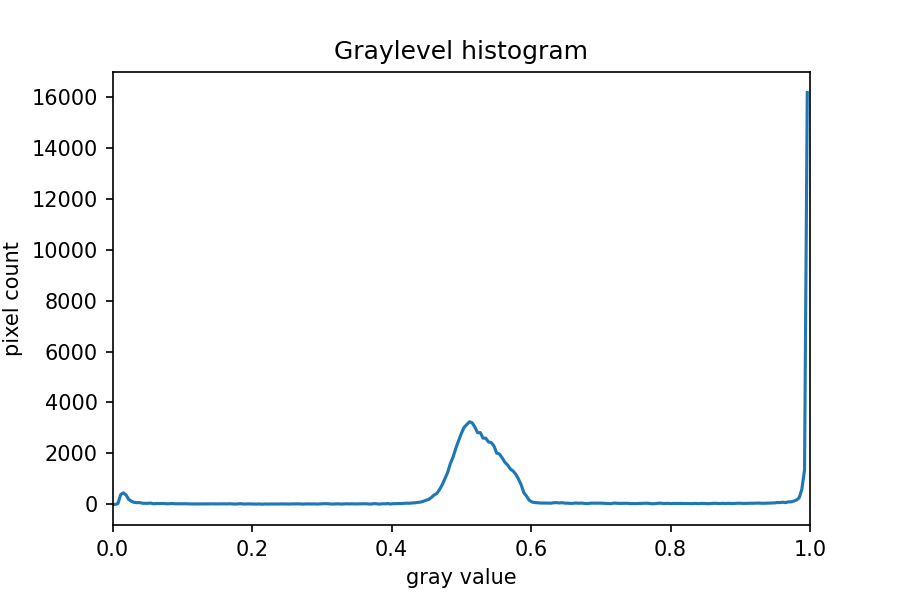
Image 1 of 1: ‘Binary mask of the bacteria colonies image’
{alt=‘Original shapes image’
.image-with-shadow}
Image 1 of 1: ‘Mask created by thresholding’
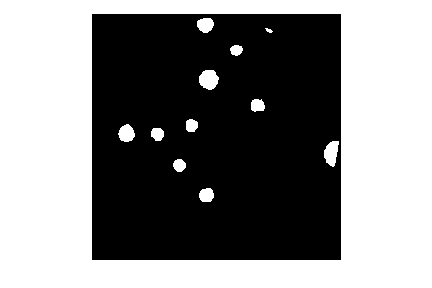
Image 1 of 1: ‘Labeled objects’
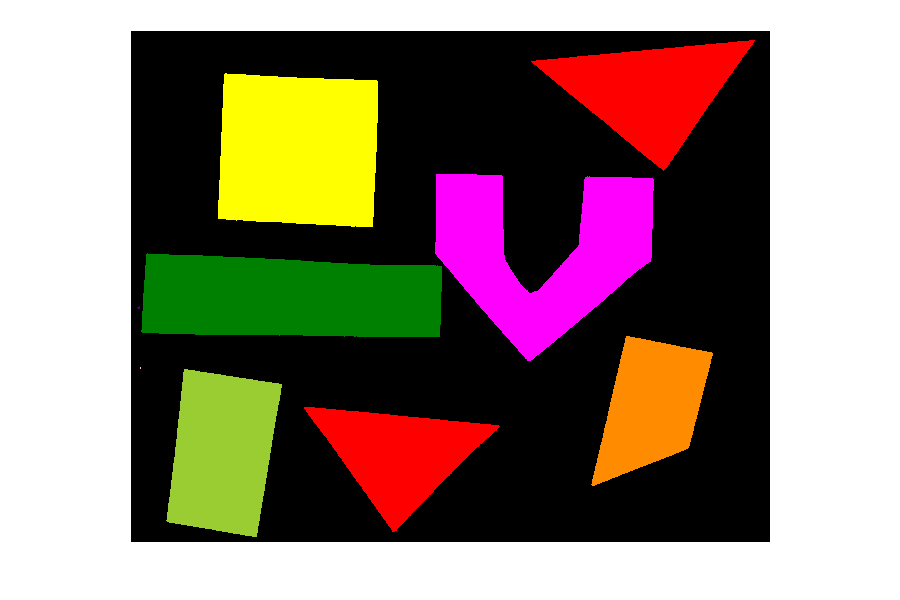
Image 1 of 1: ‘shapes-01.jpg mask detail’
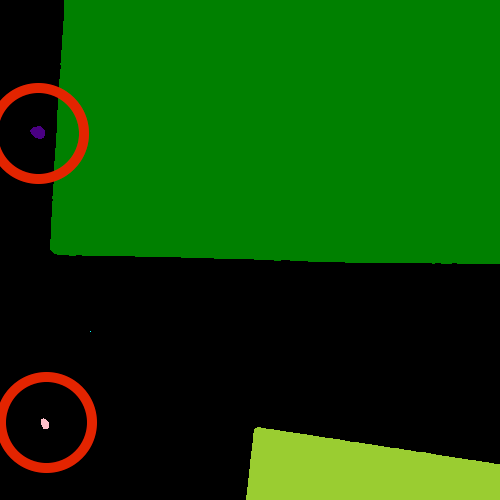
Image 1 of 1: ‘Histogram of object areas’
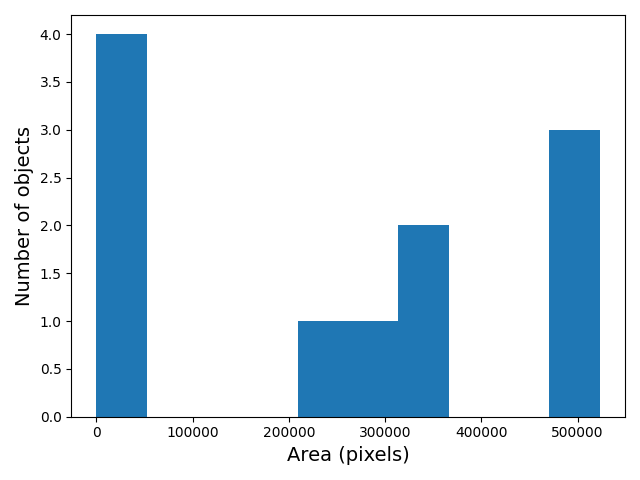
Image 1 of 1: ‘Objects filtered by area’
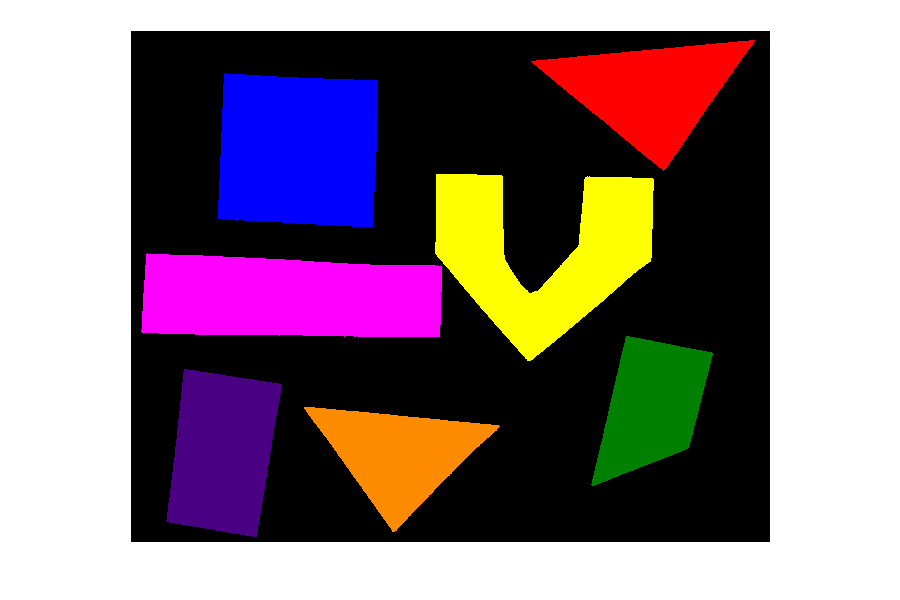
Image 1 of 1: ‘Objects colored by area’
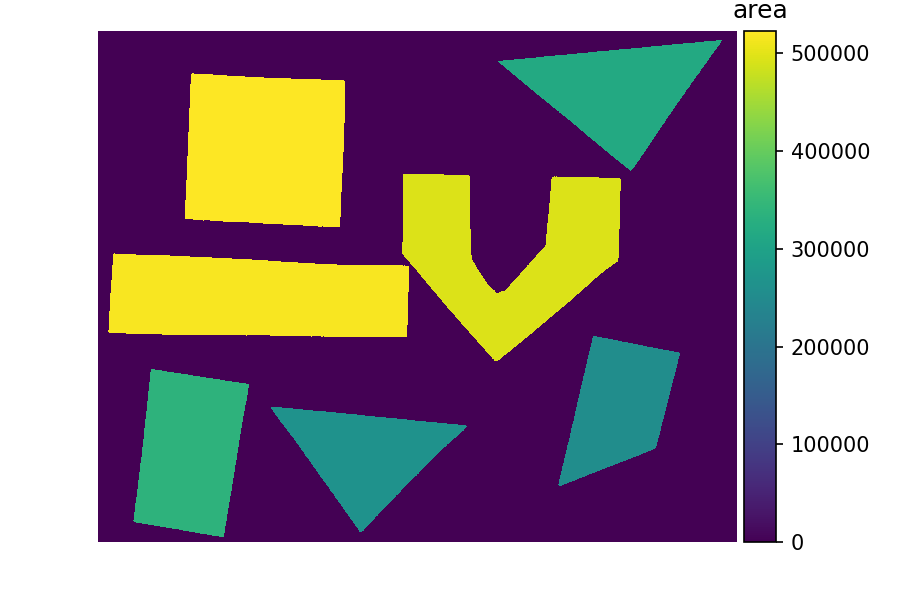
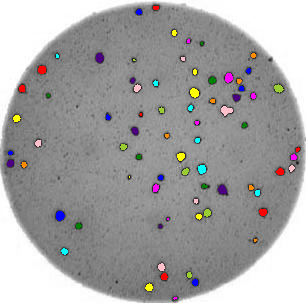
Image 1 of 1: ‘Colony image 1’
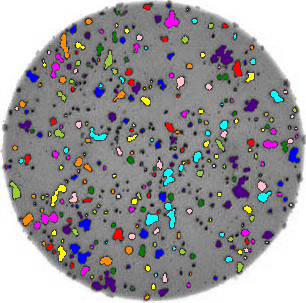
Image 1 of 1: ‘Colony image 2’
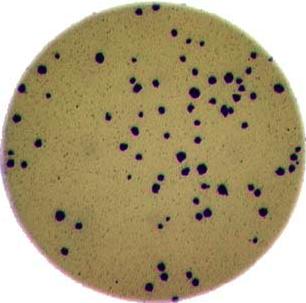
Image 1 of 1: ‘Colony image 3’
Image 1 of 1: ‘Sample morphometric output’
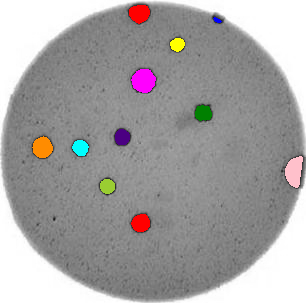
Image 1 of 1: ‘Colony image 1’
Image 1 of 1: ‘Gray Colonies’
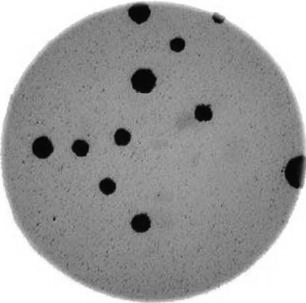
Image 1 of 1: ‘Histogram image’
Image 1 of 1: ‘Colony mask image’
Image 1 of 1: ‘Sample morphometric output’
Image 1 of 3: ‘Colony 1 output’
Image 2 of 3: ‘Colony 2 output’
Image 3 of 3: ‘Colony 3 output’